
Natural Resources
Conservation Service
Ecological site BX012X02B072
Steep Skeletal 10-14 Inch Precipitation Zone Lost River Mountains
Last updated: 5/07/2025
Accessed: 05/20/2025
General information
Provisional. A provisional ecological site description has undergone quality control and quality assurance review. It contains a working state and transition model and enough information to identify the ecological site.
MLRA notes
Major Land Resource Area (MLRA): 012X–Lost River Valleys and Mountains
Major Land Resource Area (MLRA) 012X, Lost River Valleys and Mountains, consists of approximately 4.85 million acres in Idaho. MLRA 012X is broken into two Land Resource Units (LRU) based on geology, landscape, common soils, water resources, and plant community potentials. The elevation ranges from approximately 3,600 feet (1,100 meters) in the valleys and extends to the highest point in Idaho, Mt. Borah, at 12,662 feet (3,869 meters). Annual precipitation has a significant range from six to 47 inches, the driest areas in the valley bottoms and the wettest areas on the mountain summits. This MLRA encompasses portions of the Salmon-Challis National Forest, small amounts of private land, as well as other public land managed by the State of Idaho and the Bureau of Land Management. The Continental Divide runs through the Beaverhead Mountain Range directly east of the MLRA and adjacent forests and parks include the Beaverhead National Forest, Custer Gallatin National Forest, Caribou-Targhee National Forest, and Craters of the Moon National Park.
LRU notes
The Lost River Mountain LRU is located on the Lemhi, Lost River, and White Knob Mountain Ranges. These mountain ranges extend from Salmon, Idaho to the north, Craters of the Moon National Monument to the south, the Beaverhead Mountain Range to the east, and the Sawtooth Mountains to the west. This LRU borders MLRA 043B - Central Rocky Mountains, and a small portion of MLRA 010X - Central Rocky Mountains and Foothills.
The geology of this LRU is comprised mostly of colluvium from the Challis Volcanic Group, limestone from the Permian to Mississippian Period, and till from Pleistocene glacial deposits. Additionally, metasedimentary formations from the Proterozoic dominate the Lemhi Range. The elevation range of this LRU is similar to that of the MLRA (approximately 4,000 to 12,500 feet). The boundary of the unit begins where the three mountain ranges meet the valley floor and extends to the mountain peaks. Effective precipitation (estimate of the moisture available for plant use and soil forming processes at a given site) generally ranges between 10 to greater than 36 inches. The soil temperature regimes present are frigid and cryic, and the soil moisture regimes include xeric and udic. The soils for the LRU are dominated by mollisols and inceptisols from limestone and quartzite parent material, as well as glacial till.
Classification relationships
Relationship to Other Established Classification Systems
National Vegetation Classification System (NVC):
3 Semi-Desert
3.B.1 Cool Semi-Desert Scrub & Grassland
3.B.1.Ne Western North American Cool Semi-Desert Scrub & Grassland Division
M170 Great Basin-Intermountain Dry Shrubland & Grassland Macrogroup
G304 Intermountain Mountain Big Sagebrush Steppe and Shrubland Group
A3208 Mountain Big Sagebrush - Mixed Steppe and Shrubland Alliance
CEGL001030 Mountain Big Sagebrush/Bluebunch Wheatgrass Shrubland Association
Ecoregions (EPA):
Level I: 10 Northwestern Forested Mountains
Level II: 10.1 Western Cordillera
Level III: 10.1.4 Middle Rockies
Ecological site concept
The Steep Skeletal 10 - 14 Inch Precipitation Zone (StSk 10 to 14-inch ) is an upland ecological site with a high volume (greater than 35 percent average) of coarse fragments in the top 20 inches (50 centimeters) of the soil profile. The size of coarse fragments in the soil profile are gravel or larger and often consists of a combination of different fragment sizes. This site is also found on slopes greater than 30 percent. The site is moderately deep to very deep to lithic restrictions and does not receive additional moisture outside of annual precipitation.
These soils:
o Are not saline, saline-sodic, or sodic
o Are moderately deep, deep, or very deep
o Have a high volume of coarse fragments (greater than 35 percent) in the top 20 inches (50 centimeters)
o Occur on slopes greater than 30 percent
The primary limiting factors shaping plant communities for this ecological site involve water holding capacity in the rooting zone. The high volume of coarse fragments allows water to rapidly drain deeper into the soil profile where it is less accessible to plants. As a result, plants that dominate these communities tend to have adaptations that allow them to be successful with less available moisture. Production values often tend to be lower than similar sites with soil profiles that are less skeletal. Moderate relative effective annual precipitation at this site may lessen the resource restrictions created by lower water holding capacity.
Associated sites
| BX012X02B026 |
Loamy Calcareous 10-14 Inch Precipitation Zone Lost River Mountains This site is driven by limestone parent material and can be found adjacent to Steep Skeletal sites on the landscape. |
|---|---|
| BX012X02C068 |
Skeletal 15-19 Inch Precipitation Zone Lost River Mountains This site can occur adjacent where the slope steepness drops below 30 percent, but high volumes of coarse fragments remain in the top 20 inches of the soil profile. |
| BX012X02B063 |
Shallow to Loamy, Calcareous 10-14 Inch Precipitation Zone Lost River Mountains This site is driven by limestone parent material and can be found adjacent to Steep Skeletal sites on the landscape. |
Similar sites
| BX012X02B034 |
Rocky Hills 10-14 Inch Precipitation Zone Lost River Mountains This site can occur on steep slopes with skeletal soils, but also tends to be shallow to moderately deep to lithic contact and have higher concentrations of calcium carbonates in the top 20 inches. |
|---|---|
| BX012X02B020 |
Limy 10 to 14 Inch Precipitation Zone Lost River Mountains This site can also have a high volume of coarse fragments in the soil profile, however, also has highly calcareous soils at the surface. |
| BX012X02B063 |
Shallow to Loamy, Calcareous 10-14 Inch Precipitation Zone Lost River Mountains This site can also have a high volume of coarse fragments in the soil profile, however, also has highly calcareous soils in the four to 10 inch depth of the soil profile.. |

Figure 1.
Table 1. Dominant plant species
| Tree |
Not specified |
|---|---|
| Shrub |
(1) Artemisia tridentata |
| Herbaceous |
(1) Pseudoroegneria spicata |
Legacy ID
R012XB072ID
Physiographic features
This site can occur on mountain slopes within the mountain landscape. The site is not aspect dependent, though sites favor west, south, and easterly aspects. Aspects may influence the elevation at which this ecological site occurs. Within the 10 to 14 inch relative effective annual precipitation range, transition to a forested system is increasingly likely as aspects become more Northerly. This site is influenced by slope steepness, only existing on slopes greater than 30 percent. Runoff is low to moderate and flooding and ponding do not occur.
Landscape Definition:
Mountains -- A region or landscape characterized by mountains and their intervening valleys.
Landform Definition:
Mountain Slope -- A part of a mountain between the summit and the foot.
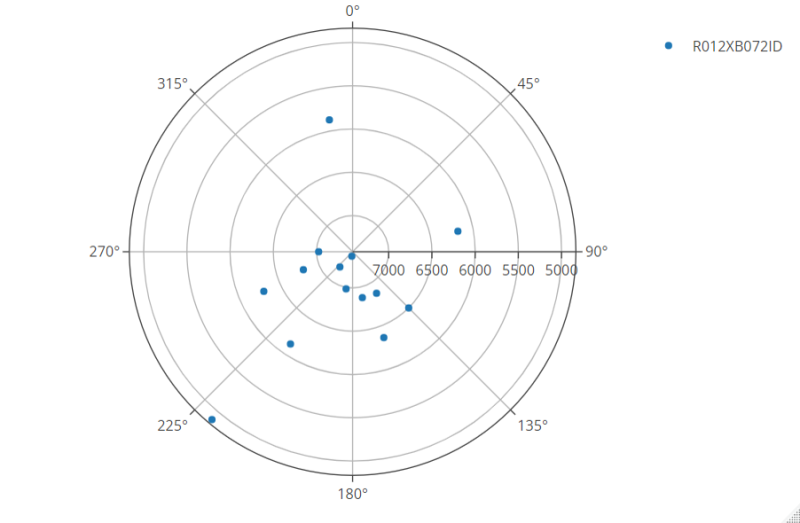
Figure 2. Plot of aspect and elevation of 14 Steep Skeletal 10 to 14 inch ecological sites.
Table 2. Representative physiographic features
| Landforms |
(1)
Mountains
> Mountain slope
|
|---|---|
| Flooding frequency | None |
| Ponding frequency | None |
| Elevation | 6,157 – 6,997 ft |
| Slope |
Not specified |
| Aspect | W, E, SE, S, SW |
Table 3. Representative physiographic features (actual ranges)
| Flooding frequency | Not specified |
|---|---|
| Ponding frequency | Not specified |
| Elevation | 5,524 – 7,248 ft |
| Slope | Not specified |
Climatic features
In the Lost River Mountain LRU, both precipitation and temperatures fluctuate significantly throughout the seasons and year to year. Relative effective annual precipitation (estimate of the moisture available for plant use and soil forming processes at a given site) generally ranges between 10 to greater than 36 inches. Average daily temperatures during the growing season (April to August) range from 33 to 57 degrees Fahrenheit. These wide fluctuations in temperature and precipitation are largely due to elevation and aspect differences as well as lower relative humidities and drier air in the mountainous terrain of the LRU. The wettest months in terms of rainfall are May and June. The growing season varies across the LRU in relation to topographical and local conditions; however, generally ranges between 30 to 90 days. Most primary growth occurs from late April through June. Soil temperature regimes include cryic and frigid and soil moisture regimes include xeric and udic.
For this Steep Skeletal ecological site, the effective precipitation is 10 to 14 inches. Effective precipitation is a modeled value that considers annual precipitation, aspect, elevation, slope, and slope shape. Often this value will be greater than or less than annual precipitation values in relation to these other characteristics. Below 10 inches and above 14 inches, a notable shift will occur in dominant plant community composition, canopy cover, and production value.
Table 4. Representative climatic features
| Frost-free period (characteristic range) | 38-51 days |
|---|---|
| Freeze-free period (characteristic range) | 86-106 days |
| Precipitation total (characteristic range) | 8-9 in |
| Frost-free period (actual range) | 34-55 days |
| Freeze-free period (actual range) | 82-110 days |
| Precipitation total (actual range) | 8-10 in |
| Frost-free period (average) | 45 days |
| Freeze-free period (average) | 96 days |
| Precipitation total (average) | 9 in |
Figure 3. Monthly precipitation range
Figure 4. Monthly minimum temperature range
Figure 5. Monthly maximum temperature range
Figure 6. Monthly average minimum and maximum temperature
Figure 7. Annual precipitation pattern
Figure 8. Annual average temperature pattern
Climate stations used
-
(1) CHILLY BARTON FLAT [USC00101671], Mackay, ID
-
(2) MACKAY LOST RIVER RS [USC00105462], Mackay, ID
Influencing water features
This is an upland ecological site and is not influenced by additional water beyond the precipitation the site receives.
Wetland description
This ecological site is not associated with wetlands.
Soil features
The soils of this site are moderately deep to very deep, ranging from 20 to greater than 60 inches (50 to 150 centimeters) and consist of textures ranging from fine sandy loams to clay loams, often with gravelly or cobbly modifiers. Soils are skeletal, averaging 35 percent or greater coarse fragments in the top 20 inches (50 centimeters) . Soils are well to somewhat excessively well drained.
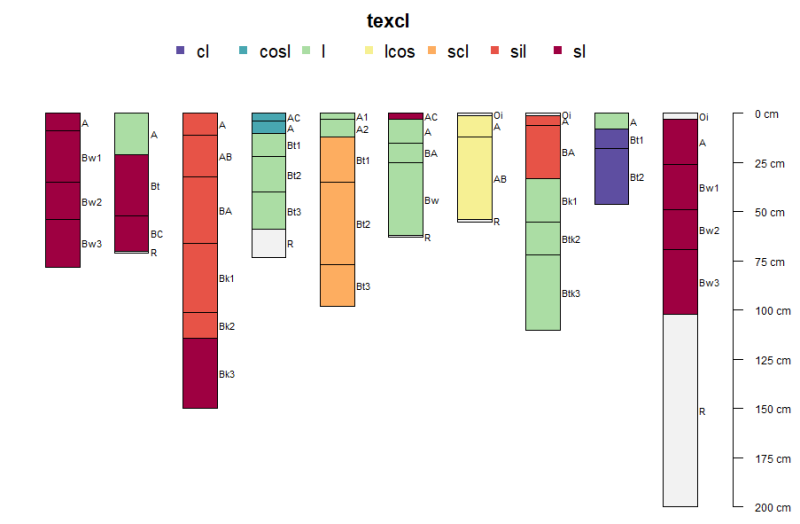
Figure 9. Plot of 10 Steep Skeletal sites showing soil texture classes by horizon.
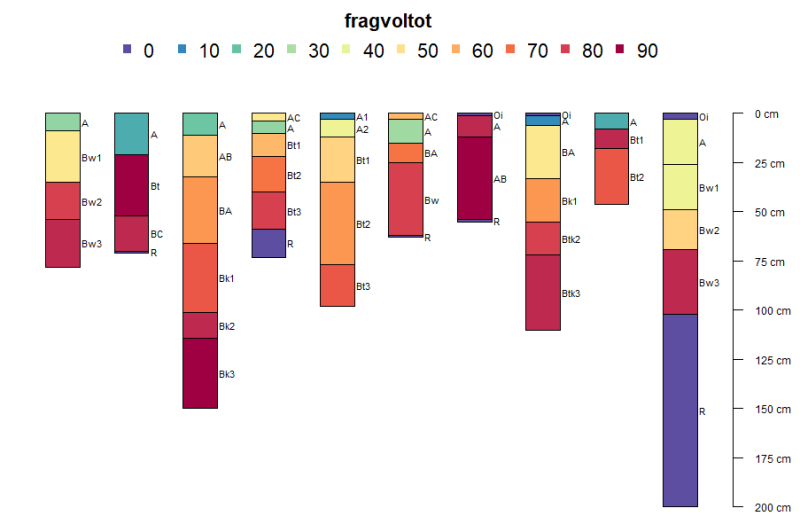
Figure 10. Plot of 10 Steep Skeletal sites showing course fragment volume by horizon.
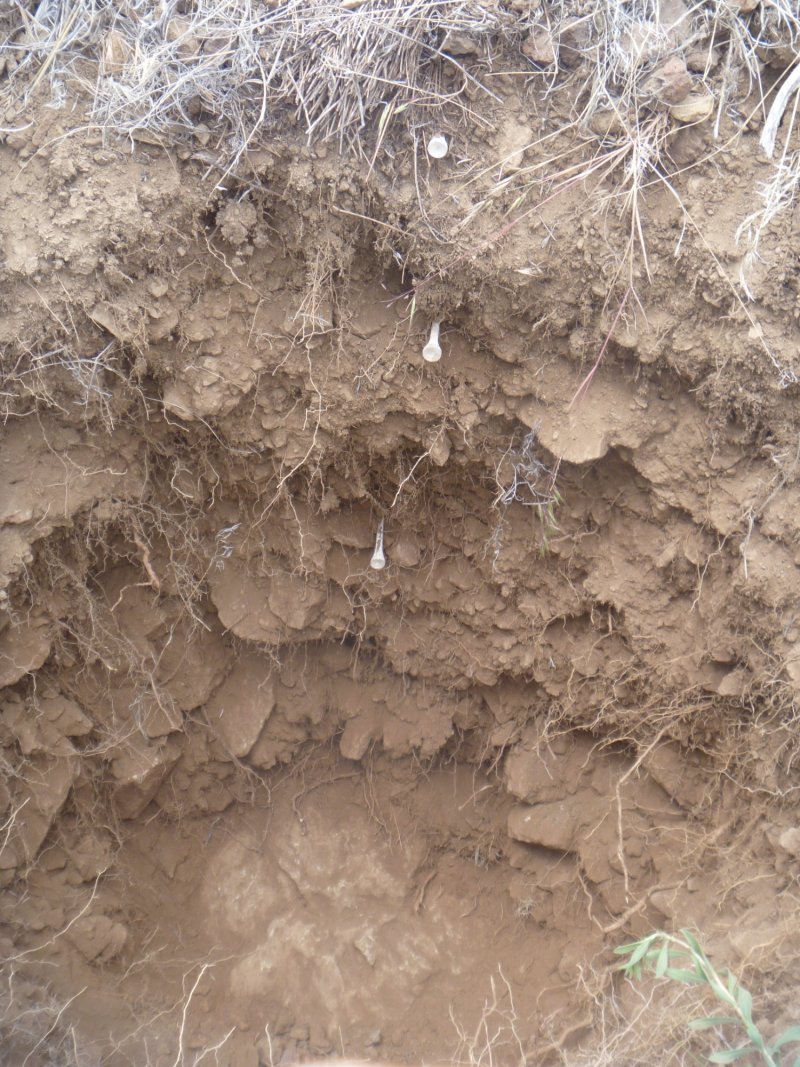
Figure 11.
Table 5. Representative soil features
| Parent material |
(1)
Colluvium
–
metasedimentary rock
(2) Colluvium – quartzite (3) Colluvium – volcanic rock |
|---|---|
| Surface texture |
(1) Gravelly loam (2) Gravelly silt loam (3) Gravelly sandy loam |
| Family particle size |
(1) Loamy-skeletal |
| Drainage class | Well drained |
| Soil depth | 60 – 80 in |
| Surface fragment cover <=3" | 5 – 29% |
| Surface fragment cover >3" | 1 – 16% |
| Available water capacity (0-20in) |
0.07 – 0.15 in |
| Soil reaction (1:1 water) (0-20in) |
6.5 – 7.2 |
| Subsurface fragment volume <=3" (0-20in) |
10 – 39% |
| Subsurface fragment volume >3" (0-20in) |
5 – 15% |
Table 6. Representative soil features (actual values)
| Drainage class | Not specified |
|---|---|
| Soil depth | Not specified |
| Surface fragment cover <=3" | 2 – 42% |
| Surface fragment cover >3" | 21% |
| Available water capacity (0-20in) |
0.02 – 0.16 in |
| Soil reaction (1:1 water) (0-20in) |
6.1 – 7.4 |
| Subsurface fragment volume <=3" (0-20in) |
7 – 48% |
| Subsurface fragment volume >3" (0-20in) |
32% |
Ecological dynamics
The Steep Skeletal 10 - 14 Inch Precipitation Zone ecological site is a range ecological site existing within the greater sagebrush steppe ecosystem. The primary overstory shrub species is big sagebrush (both mountain big sagebrush and Wyoming big sagebrush) and although many different rhizomatous and bunchgrasses can exist in the understory, bluebunch wheatgrass is the primary species.
Transitions from the Reference state are driven by disturbances, both natural and anthropogenic. The two primary disturbances that impact this ecological site are fire and herbivory. To a lesser extent, climate-driven disturbances such as drought or flood can also instigate transitions within the site's range of variability. The steep slopes of this site can create frequent colluvial disturbances and promote the establishment of invasive species.
A state-and-transition model (STM) diagram for this ecological site is depicted in this section. Thorough descriptions of each state, transition, plant community phase, and pathway are found after the state-and-transition model (STM). This STM is based on available experimental research, field observations, professional consensus, and interpretations. While based on the best available information, the STM will change over time as knowledge of ecological processes increases.
Plant community composition within this ecological site has a natural range of variability across the LRU due to the natural variability in weather, soils, and aspect. The reference plant community may not fit management goals. Selection of other plant communities is valid if the identified range health attributes have none to slight or slight departures from the Reference State. The biological processes on this site are complex; therefore, representative values are presented in a land management context. The species lists are representative and are not botanical descriptions of all species potentially occurring on this site. They are not intended to cover every situation or the full range of conditions, species, and responses for the ecological site.
Both percent species composition by weight and percent cover are used in this ecological site description. Foliar cover is used to define plant community phases and states in the STM. Cover drives the transitions between communities and states because of the influence of shade and interception of rainfall.
Species composition by dry weight remains an important descriptor of the herbaceous community and of site productivity as a whole and includes both herbaceous and woody species. Calculating the similarity index requires data on species composition by dry weight.
Although there is considerable qualitative experience supporting the pathways and transitions within the STM, no quantitative information exists that specifically identifies threshold parameters between reference states and degraded states in this ecological site.
State and transition model
More interactive model formats are also available.
View Interactive Models
Click on state and transition labels to scroll to the respective text
Ecosystem states
State 1 submodel, plant communities
State 2 submodel, plant communities
State 3 submodel, plant communities
State 1
Reference State
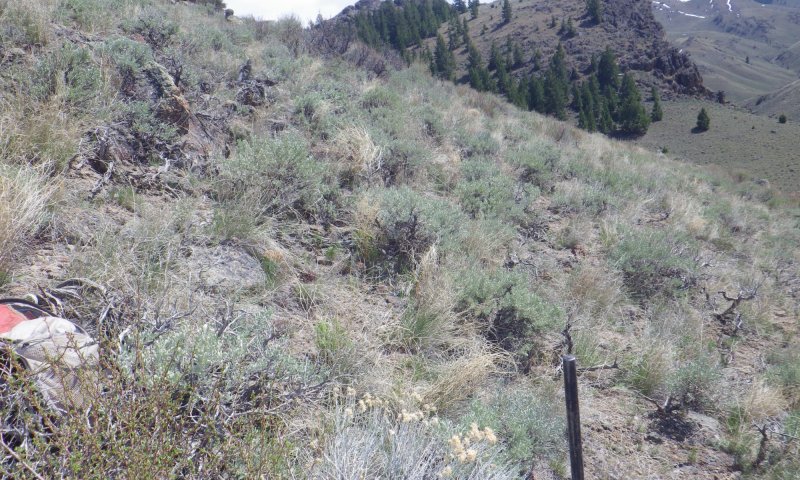
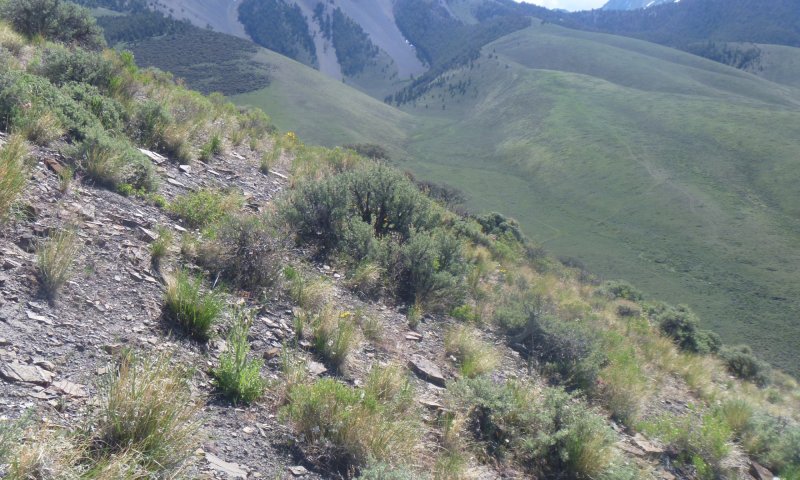
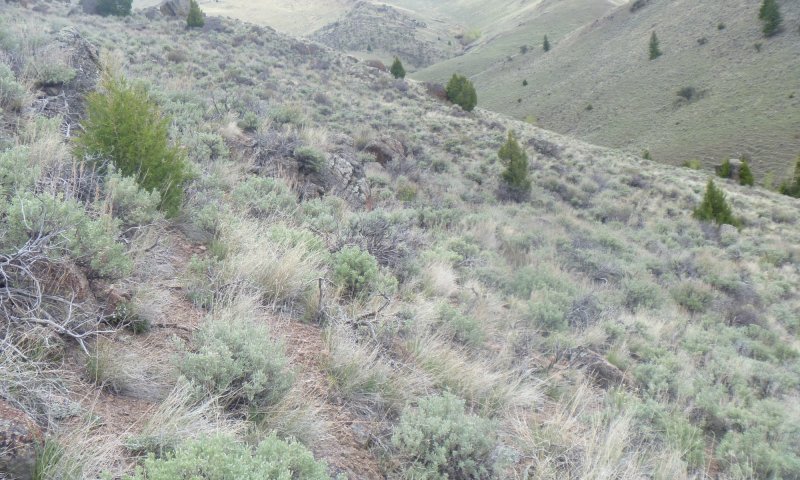
Figure 12. Site ID: 2019ID7031020
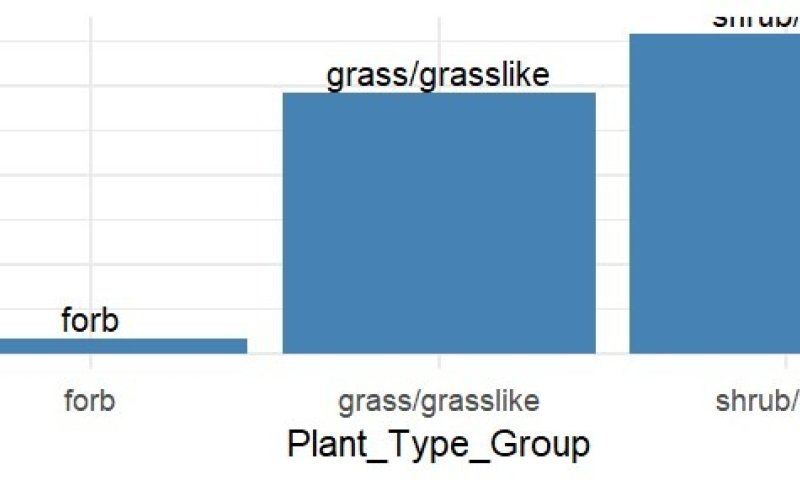
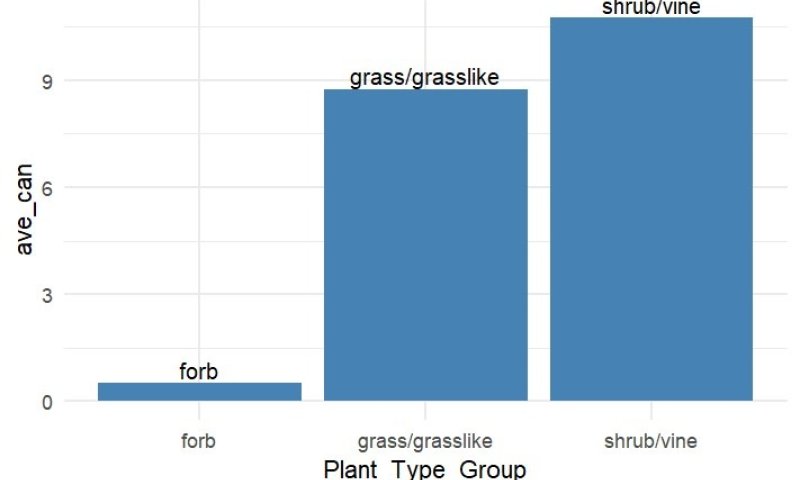
Figure 13. Plot of canopy cover by plant functional group from for Steep Skeletal ecological sites in the Reference State.
The Reference state consists of two plant communities: The Big Sagebrush/Bluebunch Wheatgrass community (1.1) and the Mixed Shrub/Bunchgrass community (2.2). The overstory in Community 1.1 is dominated by either mountain big sagebrush (Artemisia tridentata spp. vasayana), Wyoming big sagebrush (Artemisia tridentata spp. wyomingensis), or a mix of the two species. The understory is primarily composed of bunchgrasses, with bluebunch wheatgrass (Pseudoroegneria spicata) being the most prevalent. Community 1.2 has a mixed shrub overstory that can include big sagebrush species, little sagebrush (Artemisia arbuscula), chokecherry (Prunus virginiana), antelope bitterbrush (Purshia tridentata), and yellow rabbitbrush (Chrysothamnus viscidiflorus) with a bunchgrass dominated understory. The Big Sagebrush and Bluebunch Wheatgrass community is the most common community of the reference state and is also the most productive. Canopy cover and production values are close to evenly balanced between the shrub and grass functional groups and forb canopy cover is low. The Mixed Shrub/Bunchgrass community has a greater diversity in the shrub overstory with a similar understory of bunchgrasses to Community 1.1. Like Community 1.1, canopy cover and production is evenly balanced between the shrub and grass functional groups with forb canopy cover and production being comparatively low. Processes (both natural and anthropogenic) that can result in state and community changes include fire, grazing, land use change, and occurrence of invasive species (Davies et al., 2011).
Characteristics and indicators. The transition between states at this ecological site is generally driven by sagebrush killing disturbances or lack thereof. Historically, low to mixed severity fires occurred at relatively frequent fire return intervals of 10-25 years, limiting sagebrush canopy density and creating a mosaic of sagebrush stands and more open grasslands (Knick, Holmes, & Miller, 2005). Exclusion of fire (in conjunction with climate change) increases sagebrush canopy cover and can lead to more severe stand replacing fires, often times at more frequent intervals. These severe fires can drive shifts to grassland communities as well as create opportunities for invasive species establishment (Roadhouse, Irvine, & Bowerstock, 2020; Knick et al., 2005). Improper grazing practices can also lead to an increase in sagebrush canopy cover and increased risk of severe, stand replacing fire occurrence. Removal of understory grasses can lessen the opportunities for low severity fire occurrence which leads to increased canopy densities and increases potential for severe fire disturbance events (Knick et al., 2005).
Resilience management. This site has moderate to high resilience as a result of the cryic soil temperature regime and xeric soil moisture regime. Resistance and resilience of a specific site has been attributed with abiotic conditions favorable to plant growth and reproduction (Maestas et al. 2016). Soils that fall within the xeric (wet) moisture regime tend to have higher diversity and production, and are therefore more resilient. This is specifically true in terms of resisting or recovering from invasion post disturbance (Maestas et al., 2016).
Community 1.1
Big Sagebrush and Bluebunch Wheatgrass Community
This community is well adapted to the abiotic conditions of the Lost River Mountain LRU, specifically when soils are well drained, skeletal and steep. Mountain big sagebrush can occur on Mollisols, Aridisols, and Inceptisols, however, is most abundant on Mollisols (Innes, 2017). As seen in this community, mountain big sagebrush has the ability to form dense monocultures with little competition from other shrub species. The understory is dominated by bunchgrasses, primarily bluebunch wheatgrass, and to a lesser extent Sandberg bluegrass (Poa secunda). Mountain big sagebrush is the least drought tolerant of the big sagebrush species. On the landscape, transition from Wyoming big sagebrush and low sagebrush dominated communities to communities dominated by Mountain big sagebrush usually occurs along a gradient of increasing available soil moisture. Seedling establishment of mountain big sagebrush is highly dependent on available moisture and seedling mortality increases during periods of drought (Innes, 2017). Total annual production on this ecological in this community ranges from 550 to 800 pounds per acre, averaging 675 pounds per acre. Canopy cover of big sagebrush averages 20 percent and accounts for an average of 250 pounds per acre of annual production. Canopy cover of bluebunch wheatgrass also averages 20 percent and accounts for300 pounds per acre of annual production. Although gaps in the canopy can exceed 6 feet, they are generally limited to less than 2 feet and occupy less than 6 percent of a 100 foot transect.
Resilience management. This community has moderately low resilience. Mountain big sagebrush is the least drought tolerant of the big sagebrush species. Mountain big sagebrush is highly flammable and fire typically kills plants within the disturbance area. Because this species reproduces via seed that is dispersed through wind, water, and zoochory, distance from a viable source population plays a major role in post disturbance regeneration. When disturbance events cover a large area spatially, regeneration timespan increases and likelihood of transitioning to another state or community increases (Innes, 2017). Slow regeneration can open windows for erosion to occur and invasive species to establish. Post disturbance seeding and planting can increase restoration success. Bluebunch wheatgrass is a much more resilient species to the local disturbance regimes. The species is drought tolerant and usually is not killed except during the most severe wildfire events. During severe disturbances that remove the sagebrush overstory, bluebunch wheatgrass can persist as the dominant vegetation on this ecological site (Zlatnik, 1999).
Dominant plant species
-
big sagebrush (Artemisia tridentata), shrub
-
bluebunch wheatgrass (Pseudoroegneria spicata), grass
Figure 14. Annual production by plant type (representative values) or group (midpoint values)
Table 7. Annual production by plant type
| Plant type | Low (lb/acre) |
Representative value (lb/acre) |
High (lb/acre) |
|---|---|---|---|
| Shrub/Vine | 280 | 320 | 360 |
| Grass/Grasslike | 290 | 310 | 330 |
| Forb | 40 | 55 | 65 |
| Total | 610 | 685 | 755 |
Table 8. Ground cover
| Tree foliar cover | 0% |
|---|---|
| Shrub/vine/liana foliar cover | 9-21% |
| Grass/grasslike foliar cover | 7-22% |
| Forb foliar cover | 2-9% |
| Non-vascular plants | 0% |
| Biological crusts | 0-5% |
| Litter | 10-35% |
| Surface fragments >0.25" and <=3" | 8-20% |
| Surface fragments >3" | 2-10% |
| Bedrock | 0% |
| Water | 0% |
| Bare ground | 3-12% |
Table 9. Soil surface cover
| Tree basal cover | 0% |
|---|---|
| Shrub/vine/liana basal cover | 1-3% |
| Grass/grasslike basal cover | 2-5% |
| Forb basal cover | 0-1% |
| Non-vascular plants | 0% |
| Biological crusts | 0-8% |
| Litter | 0% |
| Surface fragments >0.25" and <=3" | 40-70% |
| Surface fragments >3" | 5-15% |
| Bedrock | 0% |
| Water | 0% |
| Bare ground | 15-40% |
Community 1.2
Little Sagebrush and Bluebunch Wheatgrass Community
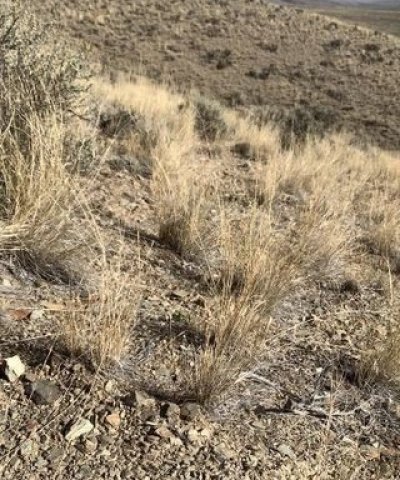
Figure 15. Site ID: 2021ID7033164
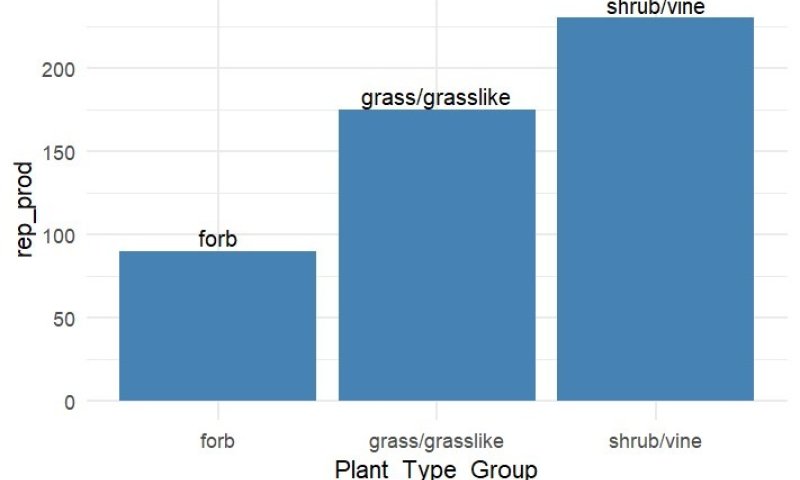
Figure 16. Production by functional group of sites in community 1.2.
The Little Sagebrush and Bluebunch Wheatgrass community within the Steep Skeletal 10 - 14 Inch Precipitation Zone ecological site is rare but generally indicates a very localized change in soil conditions or an increase in calcium carbonate concentration within the soil profile. Little sagebrush (Artemesia arbuscula) is well adapted to soils that are shallow to a restrictive layer such as bedrock, clay, or in the instance of this ecological site, tightly packed course fragments in the rooting depth. Little sagebrush is well adapted to the low effective precipitation of this site and to tolerate prolonged drought conditions and limited moisture. Production in Community 1.2 is slightly lower than in Community 1.1 due to the change in shrub composition. Production values are still close to equal between the shrub functional group and herbaceous species (grasses and forbs). Production values range from 400 to 750 pounds per acre, averaging 550 pounds per acre.
Resilience management. Resilience in this community is slightly higher than that of Community 1.1, as little sagebrush is a more drought-tolerant species than mountain big sagebrush. Resilience to insect and disease disturbances in this community is greater when the shrub canopy is more diverse, decreasing the likelihood of complete overstory die-off in the event of a disturbance.
Dominant plant species
-
little sagebrush (Artemisia arbuscula ssp. longiloba), shrub
-
bluebunch wheatgrass (Pseudoroegneria spicata), grass
-
rosy pussytoes (Antennaria rosea), other herbaceous
Figure 17. Annual production by plant type (representative values) or group (midpoint values)
Table 10. Annual production by plant type
| Plant type | Low (lb/acre) |
Representative value (lb/acre) |
High (lb/acre) |
|---|---|---|---|
| Grass/Grasslike | 150 | 175 | 310 |
| Shrub/Vine | 175 | 230 | 260 |
| Forb | 60 | 90 | 125 |
| Total | 385 | 495 | 695 |
Table 11. Ground cover
| Tree foliar cover | 0% |
|---|---|
| Shrub/vine/liana foliar cover | 7-23% |
| Grass/grasslike foliar cover | 8-22% |
| Forb foliar cover | 3-11% |
| Non-vascular plants | 0% |
| Biological crusts | 0-5% |
| Litter | 10-35% |
| Surface fragments >0.25" and <=3" | 8-20% |
| Surface fragments >3" | 2-10% |
| Bedrock | 0% |
| Water | 0% |
| Bare ground | 3-12% |
Table 12. Soil surface cover
| Tree basal cover | 0% |
|---|---|
| Shrub/vine/liana basal cover | 1-3% |
| Grass/grasslike basal cover | 2-5% |
| Forb basal cover | 0-1% |
| Non-vascular plants | 0% |
| Biological crusts | 0-8% |
| Litter | 0% |
| Surface fragments >0.25" and <=3" | 35-70% |
| Surface fragments >3" | 5-15% |
| Bedrock | 0% |
| Water | 0% |
| Bare ground | 15-40% |
Figure 18. Plant community growth curve (percent production by month). ID0310, ARARL/FEID/ PSSPS. State 1.
| Jan | Feb | Mar | Apr | May | Jun | Jul | Aug | Sep | Oct | Nov | Dec |
|---|---|---|---|---|---|---|---|---|---|---|---|
| J | F | M | A | M | J | J | A | S | O | N | D |
| 0 | 0 | 5 | 25 | 35 | 20 | 5 | 0 | 5 | 5 | 0 | 0 |
Pathway P1-2
Community 1.1 to 1.2
The transition from Community 1.1 to 1.2 is a result of slight localized changes to soil depth or chemistry within the rooting depth. Both low sage species, black and little sagebrush are well adapted to shallow and calcareous soils. Within Steep Skeletal 10 - 14 Inch Precipitation Zone ecological site, variations in depth to bedrock or localized increases in calcium carbonate concentration can result in shifts from a big sagebrush-dominated site to a site dominated by black sagebrush, little sagebrush, or a mixed population of the two. Mountain or Wyoming big sagebrush can still exist within the canopy of this community, however, canopy cover is greatly decreased compared with that of Community 1.1.
Context dependence. The changes in abiotic conditions that drive the transition from Community 1.1 to 1.2 usually occur at or near the transition zones of other ecological sites. As these conditions become more prominent and reach certain levels, the ecological site changes.
State 2
Invaded State
Figure 19. Site ID: 2021ID7031226
The Invaded State exists when invasive species occupy a significant portion of a site's canopy cover. Recruitment of invasive species often follows a localized site disturbance such as fire or chronic defoliation of native plants from improper grazing. The establishment of invasive species on a nearby site increases the likelihood of transition from the Reference state to the Invaded state due to the presence of a seed source.
Characteristics and indicators. This state is characterized by a significant canopy cover of invasive species on a site. The threshold for transition to the Invaded state is a canopy cover of five percent or more of a single invasive species or a collective canopy cover of more than eight percent for all invasive species at a site.
Resilience management. This site has low resilience primarily due to the invasive species establishment. Cheatgrass is well adapted to post-disturbance establishment, particularly after wildfire disturbances. Cheatgrass takes advantage of prolific seedbanks resilient to fire and its ability to rapidly establish when competition from native vegetation has been removed. Additionally, cheatgrass is able to alter fire regimes, shortening fire return intervals which provides a further advantage for cheatgrass and hinders re-establishment of native vegetation (Zouhar, 2003). Once fully established, restoration of sites invaded by cheatgrass either through natural or mechanical means has low success rates.
Dominant plant species
-
big sagebrush (Artemisia tridentata), shrub
-
little sagebrush (Artemisia arbuscula), shrub
-
bluebunch wheatgrass (Pseudoroegneria spicata), grass
-
cheatgrass (Bromus tectorum), grass
Community 2.1
Invasive Species Community
Figure 20. Site ID: 2020ID7032173
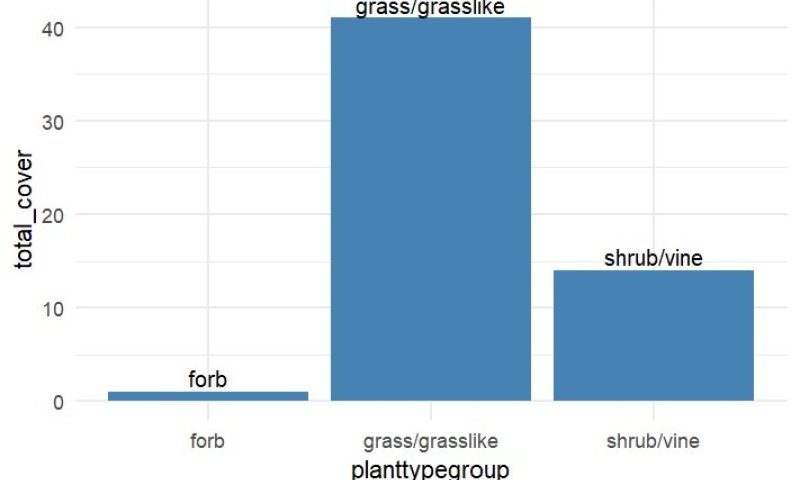
Figure 21. Canopy cover by plant functional group in Community 2.1.
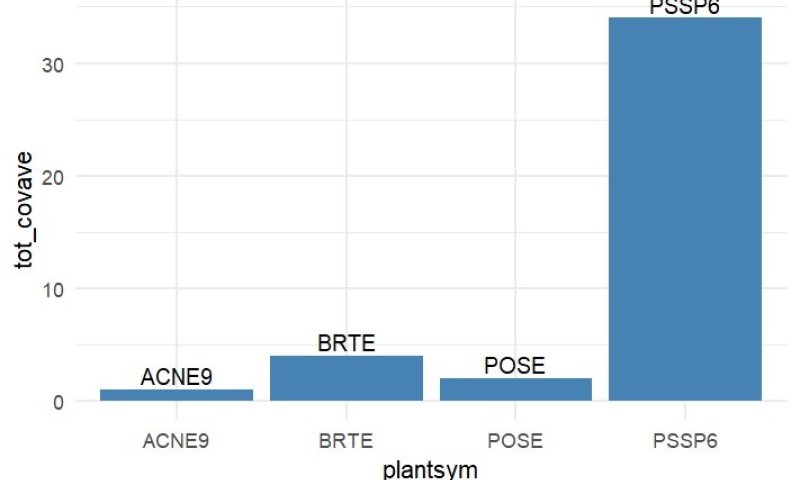
Figure 22. Canopy cover by grass species for Community 2.1.
The Invasive Species Community becomes dominant on a site where native vegetation has been removed or severely altered by either natural or anthropogenic disturbances. Once invasive species, primarily cheatgrass has established, these species can outcompete the native vegetation that it replaced and promote feedback loops (such as shortened fire return intervals) that help perpetuate dominance (Zouhar, 2003). Depending on the disturbance that caused the transition to the Invaded state, the shrub canopy can also be significantly altered. The shrub composition can shift from that of big and little sagebrush species to more disturbance-tolerant species such as yellow rabbitbrush (Chrysothamnus viscidiflorus) and rubber rabbitbrush (Ericameria nauseousa). If continued disturbance occurs on a site, yellow rabbitbrush can become the dominant overstory shrub. Production in this community can be highly variable depending on disturbance history and levels of invasive species establishment. The range of production is 450 to 800 pounds per acre, averaging 600 pounds per acre.
Figure 23. Annual production by plant type (representative values) or group (midpoint values)
Table 13. Annual production by plant type
| Plant type | Low (lb/acre) |
Representative value (lb/acre) |
High (lb/acre) |
|---|---|---|---|
| Grass/Grasslike | 225 | 300 | 450 |
| Shrub/Vine | 175 | 275 | 350 |
| Forb | 25 | 50 | 75 |
| Total | 425 | 625 | 875 |
Table 14. Ground cover
| Tree foliar cover | 0% |
|---|---|
| Shrub/vine/liana foliar cover | 8-20% |
| Grass/grasslike foliar cover | 16-32% |
| Forb foliar cover | 2-8% |
| Non-vascular plants | 0% |
| Biological crusts | 0% |
| Litter | 25-65% |
| Surface fragments >0.25" and <=3" | 5-15% |
| Surface fragments >3" | 1-5% |
| Bedrock | 0% |
| Water | 0% |
| Bare ground | 5-18% |
Table 15. Soil surface cover
| Tree basal cover | 0% |
|---|---|
| Shrub/vine/liana basal cover | 1-3% |
| Grass/grasslike basal cover | 2-6% |
| Forb basal cover | 0-2% |
| Non-vascular plants | 0% |
| Biological crusts | 0% |
| Litter | 0% |
| Surface fragments >0.25" and <=3" | 17-40% |
| Surface fragments >3" | 3-10% |
| Bedrock | 0% |
| Water | 0% |
| Bare ground | 45-70% |
State 3
Encroached State
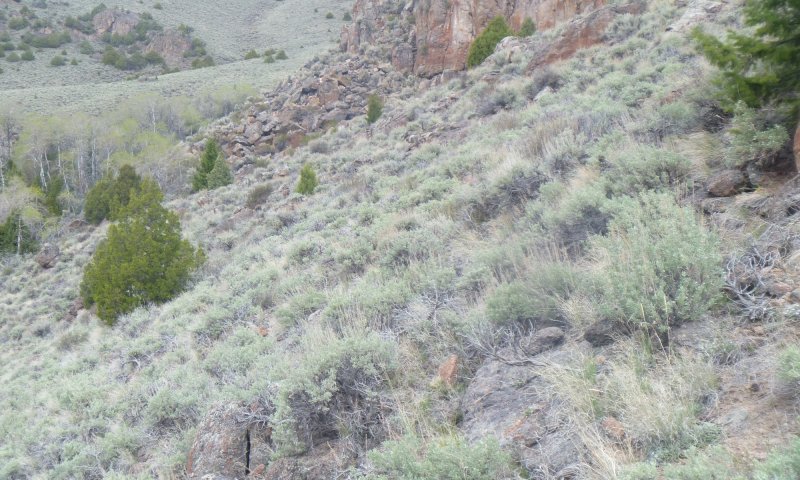
Figure 24. Site ID: 2019ID7032007
The Encroached state occurs when the fire regime at a Steep Skeletal ecological site has been altered and a nearby population of of Douglas-fir (Pseudotsuga menziesii) or Rocky Mountain juniper (Juniperus scopularum) exists. Fire return intervals for big sagebrush-dominated communities are estimated between six and 61 years (Innes, 2018). Little sagebrush has a wider range spanning 10 to 90 years (Steinberg, 2002). Low to moderate-severity fires in sagebrush communities bordering forested ecosystems are the primary mechanism restricting seedling establishment for Douglas fir and Rocky Mountain juniper species. Fire suppression practices and removal of fine fuels through agricultural grazing increase the time between fire events and allow the establishment of Douglas-fir and Rocky Mountain juniper seedlings. If enough time passes without a fire event, these seedlings become mature, become more resistant to fire events, and can provide a seed source for further encroachment.
Characteristics and indicators. This state is characterized by a canopy cover of Douglas-fir, Rocky Mountain juniper, or a combination of the two equal to or greater than two percent. Seedlings and juvenile individuals of these species occurring outside of main timber stands, mixed in with older growth sagebrush is a strong indicator of transition from the Reference state.
Resilience management. This state can be managed at current conditions or restored to the Reference state through mechanical and managed fire treatments that mimic historic disturbance regimes. Targeted mechanical thinning or use of low to moderate severity prescribed fire are useful tools to manage or restore this ecological site, and depending on levels of encroachment can often be less resource intensive.
Dominant plant species
-
Douglas-fir (Pseudotsuga menziesii), tree
-
Rocky Mountain juniper (Juniperus scopulorum), tree
-
big sagebrush (Artemisia tridentata), shrub
-
little sagebrush (Artemisia arbuscula ssp. longiloba), shrub
-
bluebunch wheatgrass (Pseudoroegneria spicata), grass
-
Sandberg bluegrass (Poa secunda), grass
Community 3.1
Encroached Shrub and Bunchgrass Community
Production in this community is slightly reduced from the Reference state due to the addition of additional overstory species. Production ranges from 475 to 750 pounds per acre, averaging 625 pounds per acre.
Dominant plant species
-
big sagebrush (Artemisia tridentata), shrub
-
little sagebrush (Artemisia arbuscula ssp. longiloba), shrub
-
bluebunch wheatgrass (Pseudoroegneria spicata), grass
-
Sandberg bluegrass (Poa secunda), grass
Figure 25. Annual production by plant type (representative values) or group (midpoint values)
Table 16. Annual production by plant type
| Plant type | Low (lb/acre) |
Representative value (lb/acre) |
High (lb/acre) |
|---|---|---|---|
| Shrub/Vine | 200 | 350 | 400 |
| Grass/Grasslike | 175 | 250 | 275 |
| Forb | 25 | 50 | 75 |
| Total | 400 | 650 | 750 |
Table 17. Ground cover
| Tree foliar cover | 2-6% |
|---|---|
| Shrub/vine/liana foliar cover | 10-23% |
| Grass/grasslike foliar cover | 7-20% |
| Forb foliar cover | 4-9% |
| Non-vascular plants | 0% |
| Biological crusts | 0% |
| Litter | 10-35% |
| Surface fragments >0.25" and <=3" | 8-20% |
| Surface fragments >3" | 2-10% |
| Bedrock | 0% |
| Water | 0% |
| Bare ground | 3-12% |
Table 18. Soil surface cover
| Tree basal cover | 1-2% |
|---|---|
| Shrub/vine/liana basal cover | 1-3% |
| Grass/grasslike basal cover | 2-5% |
| Forb basal cover | 0-2% |
| Non-vascular plants | 0% |
| Biological crusts | 0% |
| Litter | 0% |
| Surface fragments >0.25" and <=3" | 40-70% |
| Surface fragments >3" | 5-15% |
| Bedrock | 0% |
| Water | 0% |
| Bare ground | 20-45% |
Figure 26. Plant community growth curve (percent production by month). ID0701, ARTRW8/ PSSPS. State 1.
| Jan | Feb | Mar | Apr | May | Jun | Jul | Aug | Sep | Oct | Nov | Dec |
|---|---|---|---|---|---|---|---|---|---|---|---|
| J | F | M | A | M | J | J | A | S | O | N | D |
| 0 | 0 | 0 | 10 | 30 | 30 | 10 | 10 | 5 | 5 | 0 | 0 |
Transition T1-3
State 1 to 2
Transition from the Reference state to the disturbed state is often the result of invasive species establishment following a severe disturbance, or a low to moderate severity disturbance that occurs repeatedly. Disturbances such as fire and intensive grazing that result in chronic defoliation remove the canopy cover of native vegetation and create opportunities for invasive species establishment. Once established, many of the invasive species that occur on the ecological site will continue to increase in canopy cover unless interventions are applied.
Constraints to recovery. The distance to a seed source and mechanisms for seed transport of invasive species impact the likelihood of post-disturbance establishment. Many invasive species such as cheatgrass, which is the primary species of concern, can alter disturbance regimes (such as increasing fire frequency and severity) in ways that only further their establishment on a site. Mechanical and chemical treatments as well as post-treatment seeding or planting of invasive species are required for recovery, however, these treatments can be resource intensive with low success rates.
Transition T1-3
State 1 to 3
The transition from the Reference state to the Encroached state is a result of changes to fire regimes and fire frequency. Historically, fire return intervals for big sagebrush species have ranged from six to 61 years (Innes, 2018) and 10 to 90 years for little sagebrush (Steinberg, 2002). Fire suppression activities and increased agricultural grazing of understory grass species have increased the time between fire events. This allows for establishment of Douglas-fir and juniper species that would normally be excluded by fire.
Constraints to recovery. Recovery back to Reference state requires a fire event or managed thinning activities that remove the encroaching species. Fuel buildup can occur when the time between fire events is significant (greater than 90 years) and can result in severe, stand-replacing fires when they do occur.
Restoration pathway R3-1
State 3 to 1
Restoration from the Encroached state to the Reference state can happen naturally or through interventions that mimic historic disturbance regimes. Encroached sites can be restored naturally through low to moderate-severity fire occurrence that kills or dramatically decrease the presence of encroaching species. Interventions that can be used to restore a site in the Encroached state include moderate severity prescribed fire and mechanical thinning treatments, or a combination of the two.
Context dependence. High-severity fire can be stand-replacing and is not ideal for managing encroaching species. Higher severity disturbances can lead to an increase in invasive species establishment and cause a transition to the Invaded state.
Additional community tables
Table 19. Community 1.1 plant community composition
| Group | Common name | Symbol | Scientific name | Annual production (lb/acre) | Foliar cover (%) | |
|---|---|---|---|---|---|---|
|
Shrub/Vine
|
||||||
| 1 | 115–360 | |||||
| mountain big sagebrush | ARTRV | Artemisia tridentata ssp. vaseyana | 115–310 | 7–18 | ||
| Wyoming big sagebrush | ARTRW8 | Artemisia tridentata ssp. wyomingensis | 115–310 | 7–18 | ||
| yellow rabbitbrush | CHVI8 | Chrysothamnus viscidiflorus | 10–75 | 1–6 | ||
| antelope bitterbrush | PUTR2 | Purshia tridentata | 0–65 | 0–4 | ||
| rubber rabbitbrush | ERNA10 | Ericameria nauseosa | 15–55 | 1–3 | ||
| chokecherry | PRVI | Prunus virginiana | 0–55 | 0–3 | ||
| common juniper | JUCO6 | Juniperus communis | 0–35 | 0–1 | ||
|
Grass/Grasslike
|
||||||
| 2 | 270–375 | |||||
| bluebunch wheatgrass | PSSP6 | Pseudoroegneria spicata | 175–330 | 6–20 | ||
| Sandberg bluegrass | POSE | Poa secunda | 20–105 | 2–10 | ||
| Idaho fescue | FEID | Festuca idahoensis | 0–50 | 0–4 | ||
| bluegrass | POA | Poa | 0–35 | 0–3 | ||
| cheatgrass | BRTE | Bromus tectorum | 0–20 | 0–3 | ||
|
Forb
|
||||||
| 3 | 40–85 | |||||
| spiny phlox | PHHO | Phlox hoodii | 10–30 | 1–4 | ||
| pussytoes | ANTEN | Antennaria | 5–20 | 0–4 | ||
| milkvetch | ASTRA | Astragalus | 0–20 | 0–3 | ||
| Indian paintbrush | CASTI2 | Castilleja | 10–20 | 1–3 | ||
| lupine | LUPIN | Lupinus | 0–20 | 0–3 | ||
| cushion buckwheat | EROV | Eriogonum ovalifolium | 0–20 | 0–2 | ||
| longleaf phlox | PHLO2 | Phlox longifolia | 0–15 | 0–2 | ||
| tapertip hawksbeard | CRAC2 | Crepis acuminata | 0–15 | 0–2 | ||
| textile onion | ALTE | Allium textile | 0–10 | 0–1 | ||
| ragwort | SENEC | Senecio | 0–10 | 0–1 | ||
| onion | ALLIU | Allium | 0–10 | 0–1 | ||
| Baker's hawksbeard | CRBA2 | Crepis bakeri | 0–10 | 0–1 | ||
| silverleaf phacelia | PHHA | Phacelia hastata | 0–10 | 0–1 | ||
Table 20. Community 1.2 plant community composition
| Group | Common name | Symbol | Scientific name | Annual production (lb/acre) | Foliar cover (%) | |
|---|---|---|---|---|---|---|
|
Shrub/Vine
|
||||||
| 1 | 175–260 | |||||
| little sagebrush | ARARL | Artemisia arbuscula ssp. longiloba | 75–195 | 5–20 | ||
| yellow rabbitbrush | CHVI8 | Chrysothamnus viscidiflorus | 35–75 | 2–7 | ||
| rubber rabbitbrush | ERNA10 | Ericameria nauseosa | 0–55 | 0–4 | ||
| spineless horsebrush | TECA2 | Tetradymia canescens | 0–45 | 0–3 | ||
| Rocky Mountain juniper | JUSC2 | Juniperus scopulorum | 0–45 | 0–3 | ||
|
Grass/Grasslike
|
||||||
| 2 | 150–310 | |||||
| bluebunch wheatgrass | PSSP6 | Pseudoroegneria spicata | 115–225 | 8–18 | ||
| Sandberg bluegrass | POSE | Poa secunda | 35–85 | 2–7 | ||
| Indian ricegrass | ACHY | Achnatherum hymenoides | 0–35 | 0–3 | ||
| needlegrass | ACHNA | Achnatherum | 0–35 | 0–3 | ||
| needle and thread | HECO26 | Hesperostipa comata | 0–35 | 0–3 | ||
| bluegrass | POA | Poa | 0–20 | 0–2 | ||
|
Forb
|
||||||
| 3 | 60–125 | |||||
| spiny phlox | PHHO | Phlox hoodii | 10–40 | 2–5 | ||
| pussytoes | ANTEN | Antennaria | 10–35 | 2–5 | ||
| Indian paintbrush | CASTI2 | Castilleja | 10–25 | 2–4 | ||
| hawksbeard | CREPI | Crepis | 5–15 | 1–3 | ||
| longleaf phlox | PHLO2 | Phlox longifolia | 5–15 | 1–3 | ||
| stemless mock goldenweed | STAC | Stenotus acaulis | 0–15 | 0–2 | ||
| fleabane | ERIGE2 | Erigeron | 0–10 | 0–1 | ||
Table 21. Community 2.1 plant community composition
| Group | Common name | Symbol | Scientific name | Annual production (lb/acre) | Foliar cover (%) | |
|---|---|---|---|---|---|---|
|
Shrub/Vine
|
||||||
| 1 | 175–350 | |||||
| big sagebrush | ARTR2 | Artemisia tridentata | 45–300 | 5 | ||
| basin big sagebrush | ARTRT | Artemisia tridentata ssp. tridentata | 0–250 | 0–12 | ||
| yellow rabbitbrush | CHVI8 | Chrysothamnus viscidiflorus | 25–105 | 2–10 | ||
| little sagebrush | ARARL | Artemisia arbuscula ssp. longiloba | 25–85 | 2–8 | ||
| rubber rabbitbrush | ERNA10 | Ericameria nauseosa | 0–45 | 0–3 | ||
|
Grass/Grasslike
|
||||||
| 2 | 225–440 | |||||
| bluebunch wheatgrass | PSSP6 | Pseudoroegneria spicata | 176–320 | 10–22 | ||
| cheatgrass | BRTE | Bromus tectorum | 45–110 | 5–10 | ||
| Sandberg bluegrass | POSE | Poa secunda | 25–70 | 2–8 | ||
| Columbia needlegrass | ACNE9 | Achnatherum nelsonii | 0–45 | 0–3 | ||
| bluegrass | POA | Poa | 0–35 | 0–3 | ||
|
Forb
|
||||||
| 3 | 40–75 | |||||
| rush skeletonweed | CHJU | Chondrilla juncea | 10–30 | 2–5 | ||
| spotted knapweed | CEST8 | Centaurea stoebe | 10–30 | 2–5 | ||
| phlox | PHLOX | Phlox | 10–30 | 1–4 | ||
| cushion buckwheat | EROV | Eriogonum ovalifolium | 0–25 | 0–3 | ||
| rosy pussytoes | ANRO2 | Antennaria rosea | 5–15 | 1–4 | ||
| yellow salsify | TRDU | Tragopogon dubius | 5–15 | 0–3 | ||
| ragwort | SENEC | Senecio | 0–15 | 0–2 | ||
| fleabane | ERIGE2 | Erigeron | 5–15 | 0–2 | ||
Table 22. Community 3.1 plant community composition
| Group | Common name | Symbol | Scientific name | Annual production (lb/acre) | Foliar cover (%) | |
|---|---|---|---|---|---|---|
|
Shrub/Vine
|
||||||
| 1 | 200–410 | |||||
| big sagebrush | ARTR2 | Artemisia tridentata | 150–380 | 10–20 | ||
| little sagebrush | ARARL | Artemisia arbuscula ssp. longiloba | 35–125 | 2–9 | ||
| yellow rabbitbrush | CHVI8 | Chrysothamnus viscidiflorus | 35–85 | 2–7 | ||
| rubber rabbitbrush | ERNA10 | Ericameria nauseosa | 0–45 | 0–3 | ||
|
Grass/Grasslike
|
||||||
| 2 | 175–275 | |||||
| bluebunch wheatgrass | PSSP6 | Pseudoroegneria spicata | 150–275 | 7–17 | ||
| Sandberg bluegrass | POSE | Poa secunda | 45–125 | 3–10 | ||
| needlegrass | ACHNA | Achnatherum | 15–55 | 1–4 | ||
| bluegrass | POA | Poa | 0–45 | 0–3 | ||
|
Forb
|
||||||
| 3 | 30–60 | |||||
| spiny phlox | PHHO | Phlox hoodii | 10–35 | 1–3 | ||
| pussytoes | ANTEN | Antennaria | 0–15 | 0–2 | ||
| Indian paintbrush | CASTI2 | Castilleja | 5–15 | 1–2 | ||
| longleaf phlox | PHLO2 | Phlox longifolia | 0–10 | 0–1 | ||
| stemless mock goldenweed | STAC | Stenotus acaulis | 0–10 | 0–1 | ||
| fleabane | ERIGE2 | Erigeron | 0–10 | 0–1 | ||
Table 23. Community 3.1 forest overstory composition
| Common name | Symbol | Scientific name | Nativity | Height (ft) | Canopy cover (%) | Diameter (in) | Basal area (square ft/acre) |
|---|---|---|---|---|---|---|---|
Interpretations
Animal community
Listed below are production ranges for each community in the Steep Skeletal 10 - 14 Inch Precipitation Zone ecological site. These numbers can be used to estimate stocking rates; however, community composition as listed in this ecological site description may not entirely match the current composition at a given site. Field visits to document actual plant composition and production should be conducted to calculate actual stocking rates at a specific location.
Communities and their production ranges (in pounds per acre) are as follows:
In the Reference state, Community 1.1 has a range of 550 to 800, averaging 675. Community 1.2 has a range of 400 to 750, averaging 550. In the Invaded state, Community 2.1 has a range of 450 to 800, averaging 600. In the Encroached state, Community 3.1 has a range of 475 to 750, averaging 625.
Wildlife Interpretations:
Sagebrush steppe ecosystems in the Western United States cover nearly 165 million acres and provide vital habitat for over 170 different species of birds and mammals (NWF, 2022).
The sagebrush steppe in the Lost River Mountain LRU provide critical winter range for mule deer, elk, pronghorn and moose. The LRU also encompasses critical habitat for greater sage grouse populations in the Lemhi, Lost River, and White Knob Mountains. Sage grouse priority planning areas have been identified by the Challis Sage Grouse Local Working Group (CSLWG) in Grouse and Morse Creek, the Upper Pahsimeroi north of Sawmill Canyon, Mackay Bar, and Barton Flats (CSLWG, 2007). According to Idaho Fish and Game Management spatial layers developed in conjunction with the Bureau of Land Management, US Forest Service, and US Fish and Wildlife Service, greater sage grouse general habitat exists on the northern end of the White Knob Mountain range, northern end of the Pahsimeroi mountain range, and portions of the eastern side of the Lemhi and White Knob mountain ranges. More importantly to the species, significant areas designated important and priority habitat have been identified across the entirety of the White Knob, Lost River, and Lemhi mountain ranges.
The following are dominant plant species within this ecological site and their associated value to wildlife present in the LRU:
Mountain big sagebrush (Artemisia tridentata spp. vaseyana) - Communities 1.1/1.2:
Mountain big sagebrush is considered to be highly palatable by most wildlife browsers (Rosenstrater, 2005). Sage grouse, ungulates, and rodents browse mountain big sagebrush primarily during the winter when it becomes one of the more palatable available forages. However, seasonal snow levels can exclude many browsing species. Several studies have shown that Mountain big sagebrush is a preferred forage by elk, mule deer, and sage grouse when compared to the other big sagebrush species (Innes, 2017).
Black sagebrush (Artemisia nova) - Community 1.3:
Mule deer and pronghorn use black sagebrush habitats extensively. Use is especially heavy by mule deer in early decades post-fire disturbance (Communities 1.3 and 3.1). This is most prevalent within the first three decades after the fire event (Fryer, 2009). Black sagebrush-dominated sites have been shown as great winter ranges for pronghorn (Kindschy et al., 1982) and pronghorn winter distribution has been strongly associated with black sagebrush communities (Clary & Beale, 1983). Sage grouse are obligate species of black and other sagebrush varieties. Generally, big sagebrush communities are preferred by sage grouse, however, some black sagebrush sites on the Snake River Plains and in Nevada have shown to be preferred winter grounds for feeding and cover (Dalke et al., 1963). Other species of note that have shown to rely on black sagebrush communities include great basin pocket mice, Ord's kangaroo rats, sage thrashers, and a large variety of insect pollinator species (Fryer, 2009).
Little sagebrush (Artemisia arbuscula longiloba) - Community 1.3:
In early spring and winter, little sagebrush is often a preferred forage species for mule deer (Blaisdell et al., 1982). In the Great Basin, little sagebrush-dominated sites have been shown to be heavily utilized by pronghorn during the summer (Kindschy et al., 1982). Little sagebrush, among other varieties, is an important forage source for sage grouse throughout the year (Steinberg, 2002).
Threetip sagebrush (Artemisia tridentata spp. tripartita) - Community 2.1:
Generally, threetip sagebrush is not a preferred browse species for most wild ungulates. It can be used to a minor extent by mule deer in both the winter and summer and as emergency forage for other large ungulates (Tirmenstein, 1999.)
Bluebunch wheatgrass (Psuedoeogenaria spicata) - All states/communities:
Bluebunch wheatgrass is considered one of the most important forage species on Western rangelands for both livestock and wildlife (Sours, 1983). In Idaho, utilization of bluebunch wheatgrass by elk was medium-high, medium for mule deer, high for bighorn sheep, and low for pronghorn (Zlatnik, 1999).
Sandberg bluegrass (Poa secunda) - All states/communities:
Sandberg bluegrass is one of the earliest grasses to green up during the spring and become available forage for wildlife; however becomes less utilized during the later summer months. The degree of use for elk and pronghorn is good to poor, and good to fair for mule deer, small mammals, small nongame birds, and upland game birds. Usage is fair to poor by waterfowl (Howard, 1997).
Hydrological functions
Annual precipitation is the primary limiting factor of total plant production on this ecological site. Soils associated with this site are primarily associated with hydrologic group B. Runoff potential ranges from moderate to rapid and soil permeability is moderate. Water transmission through the soil is unimpeded.
Higher infiltration rates and lower runoff rates tend to coincide with ground cover percentage. Reduced infiltration and increased runoff have the greatest potential when ground cover is less than 50 percent.
Recreational uses
This ecological site provides hunting opportunities for upland game birds and large game animals including pronghorn, mule deer, elk, and moose. Many trails and campsites exist within the LRU and are maintained by public land management agencies.
The diverse plants that exist in this LRU and on this ecological site have an aesthetic value that appeals to recreationists.
Supporting information
Inventory data references
Site ID's and data collection intensity for each site used in the development of this ecological site description are listed below. Tier III data sets include five rangeland inventory protocols: Line point intercept, canopy/basal gap, production, continuous line intercept for overstory canopy, and soil stability. Tier II datasets include Line point intercept and at least one other survey. Tier I datasets include an ocular macroplot survey that involved a site plant census, canopy cover estimates, production by species estimates, and total site production estimates.
Reference State:
Community 1.1:
Tier III: 2021ID7033161
Tier I: 2019ID7031020, 2020ID7032161, 2020ID7032171
Community 1.2:
Tier I: 2021ID7033164
Invaded State:
Community 2.1:
Tier III: 2020ID7031226
Tier I: 2020ID7032173, 2021ID7033199
Encroached State:
Community 3.1:
Tier I: 2019ID7032007
Other references
Blaisdell, James P.; Murray, Robert B.; McArthur, E. Durant. 1982. Managing Intermountain rangelands--sagebrush-grass ranges. Gen. Tech. Rep. INT-134. Ogden, UT: U.S. Department of Agriculture, Forest Service, Intermountain Forest and Range Experiment Station. 41 p.
Dalke, Paul D.; Pyrah, Duane B.; Stanton, Don C.; Crawford, John E.; Schlatterer, Edward F. 1963. Ecology, productivity, and management of sage grouse in Idaho. Journal of Wildlife Management. 27(4): 810-841.
Challis Sage-grouse Local Working Group (CSLWG). 2007. Challis Sage-grouse Conservation Plan.
Clary, Warren P.; Beale, Donald M. 1983. Pronghorn reactions to winter sheep grazing, plant communities, and topography in the Great Basin. Journal of Range Management. 36(6): 749-752.
Fryer, Janet L. 2009. Artemisia nova. In: Fire Effects Information System, [Online]. U.S. Department of Agriculture, Forest Service, Rocky Mountain Research Station, Fire Sciences Laboratory (Producer). Available: https://www.fs.usda.gov/database/feis/plants/shrub/artnov/all.html
Fryer, Janet L. 1997. Amelanchier alnifolia. In: Fire Effects
Information System, [Online]. U.S. Department of Agriculture, Forest Service,
Rocky Mountain Research Station, Fire Sciences Laboratory (Producer).
Innes, Robin J. 2017. Artemisia tridentata subsp. vaseyana, mountain big sagebrush. In: Fire Effects Information System, [Online]. U.S. Department of Agriculture, Forest Service, Rocky Mountain Research Station, Missoula Fire Sciences Laboratory (Producer). Available: https://www.fs.usda.gov/database/feis/plants/shrub/arttriv/all.html
Kindschy, Robert R.; Sundstrom, Charles; Yoakum, James D. 1982. Wildlife habitats in managed rangelands--the Great Basin of southeastern Oregon: pronghorns. Gen. Tech. Rep. PNW-145. Portland, OR: U.S. Department of Agriculture, Forest Service. 18 p.
Knick, S.T.; Holmes, A.L.; Miller, Richard F. 2005. The role of fire in structuring sagebrush habitats and bird communities. Pages 63-75 In: Saab, Victoria A.; Powell, Hugh D. W. (eds.). Fire and Avian Ecology in North America. Studies in Avian Biology No. 30. Camarillo, CA: Cooper Ornithological Society.
Miller, M., Belnap, J., Beatty, S., Reynolds, R. (2006). Performance of Bromus tectorum L. in Relation to Soil Properties, Water Additions, and Chemical Amendments in Calcareous Soils of Southeastern Utah, USA. Canyonlands Research. 288. 10.1007/s11104-006-0058-4.
National Wildlife Federation (NWF). 2022. Sagebrush Steppe. Retrieved from: https://www.nwf.org/Educational-Resources/Wildlife-Guide/Threats-to-Wildlife/Climate-Change/Habitats/Sagebrush-Steppe.
Sours, John M. 1983. Characteristics and uses of important grasses for arid western rangelands. In: Monsen, Stephen B.; Shaw, Nancy, compilers. Managing Intermountain rangelands--improvement of range and wildlife habitats: Proceedings of a symposia; 1981 September 15-17; Twin Falls, ID; 1982 June 22-24; Elko, NV. Gen. Tech. Rep. INT-157. Ogden, UT: U.S. Department of Agriculture, Forest Service, Intermountain Forest and Range Experiment Station: 90-94.
Steinberg, Peter D. 2002. Artemisia arbuscula. In: Fire Effects Information System, [Online]. U.S. Department of Agriculture, Forest Service, Rocky Mountain Research Station, Fire Sciences Laboratory (Producer). Available: https://www.fs.usda.gov/database/feis/plants/shrub/artarb/all.html
Tirmenstein, D. 1999. Chrysothamnus viscidiflorus. In: Fire Effects Information System, [Online]. U.S. Department of Agriculture, Forest Service, Rocky Mountain Research Station, Fire Sciences Laboratory (Producer). Available: https://www.fs.usda.gov/database/feis/plants/shrub/chrvis/all.html
USNVC [United States National Vegetation Classification]. 2021. United States National Vegetation Classification Database, V2.031. Federal Geographic Data Committee, Vegetation Subcommittee, Washington DC. [usnvc.org]
Tirmenstein, D. 1999. Artemisia tripartita. In: Fire Effects Information System, [Online]. U.S. Department of Agriculture, Forest Service, Rocky Mountain Research Station, Fire Sciences Laboratory (Producer). Available: https://www.fs.usda.gov/database/feis/plants/shrub/arttrp/all.html [2023, January 18].
Tirmenstein, D. 1999. Chrysothamnus viscidiflorus. In: Fire Effects Information System, [Online]. U.S. Department of Agriculture, Forest Service, Rocky Mountain Research Station, Fire Sciences Laboratory (Producer).
Tirmenstein, D. 1999. Pascopyrum smithii. In: Fire Effects Information System, [Online]. U.S. Department of Agriculture, Forest Service, Rocky Mountain Research Station, Fire Sciences Laboratory (Producer). Available: https://www.fs.usda.gov /database/feis/
Zlatnik, Elena. 1999. Pseudoroegneria spicata, bluebunch wheatgrass. In: Fire Effects Information System, [Online]. U.S. Department of Agriculture, Forest Service, Rocky Mountain Research Station, Fire Sciences Laboratory (Producer). Available: https://www.fs.usda.gov /database/feis/plants/graminoid/psespi/all.html [2022, October 25].
Zlatnik, Elena. 1999. Purshia tridentata. In: Fire Effects Information System, [Online]. U.S. Department of Agriculture, Forest Service, Rocky Mountain Research Station, Fire Sciences Laboratory (Producer).
Zouhar, Kristin L. 2000. Festuca idahoensis. In: Fire Effects Information System, [Online]. U.S. Department of Agriculture, Forest Service, Rocky Mountain Research Station, Fire Sciences Laboratory (Producer).
Zouhar, Kris. 2003. Bromus tectorum. In: Fire Effects Information System, [Online]. U.S. Department of Agriculture, Forest Service, Rocky Mountain Research Station, Fire Sciences Laboratory (Producer).
Approval
Kirt Walstad, 5/07/2025
Rangeland health reference sheet
Interpreting Indicators of Rangeland Health is a qualitative assessment protocol used to determine ecosystem condition based on benchmark characteristics described in the Reference Sheet. A suite of 17 (or more) indicators are typically considered in an assessment. The ecological site(s) representative of an assessment location must be known prior to applying the protocol and must be verified based on soils and climate. Current plant community cannot be used to identify the ecological site.
| Author(s)/participant(s) | Zachary Van Abbema |
|---|---|
| Contact for lead author |
Zachary Van Abbema zachary.vanabbema@usda.gov |
| Date | 04/03/2025 |
| Approved by | Kirt Walstad |
| Approval date | |
| Composition (Indicators 10 and 12) based on | Annual Production |
Indicators
-
Number and extent of rills:
Rills are not present in the reference condition. -
Presence of water flow patterns:
Water flow patterns are uncommon in the reference condition. When present, they usually occur on steeper slopes (>15 percent) and are inconspicuous, disconnected, and very short in length. -
Number and height of erosional pedestals or terracettes:
Pedestals and/or terracettes: Pedestals are not evident in the reference condition. -
Bare ground from Ecological Site Description or other studies (rock, litter, lichen, moss, plant canopy are not bare ground):
Bare ground is between 3-12 percent, however, averaging 8%. This refers to exposed mineral soil not covered by litter, rock, basal cover, plant cover, standing dead, lichen and/or moss. -
Number of gullies and erosion associated with gullies:
Gullies are not present in the reference condition. -
Extent of wind scoured, blowouts and/or depositional areas:
Wind scoured, or depositional areas are not evident in the reference condition. -
Amount of litter movement (describe size and distance expected to travel):
Movement of fine herbaceous litter may occur within less than a foot from where it originated. -
Soil surface (top few mm) resistance to erosion (stability values are averages - most sites will show a range of values):
Soil Surface Stable with Stability Ratings of 4-6 (both under canopy and bare). Abiotic crusts and or root mats may be present. -
Soil surface structure and SOM content (include type of structure and A-horizon color and thickness):
Soil surface structure is granular with the A horizon ranging from 0 -35cm thick, averaging 19 cm thick. Predominant A horizon colors are 10YR 3/3, 10YR 3/2, or 10YR 2/2. -
Effect of community phase composition (relative proportion of different functional groups) and spatial distribution on infiltration and runoff:
Plants are evenly distributed across the ecological site and the shrubs and bunchgrasses present improved infiltration as well as protect against runoff. -
Presence and thickness of compaction layer (usually none; describe soil profile features which may be mistaken for compaction on this site):
Not present. -
Functional/Structural Groups (list in order of descending dominance by above-ground annual-production or live foliar cover using symbols: >>, >, = to indicate much greater than, greater than, and equal to):
Dominant:
Mountain big sagebrush = Bluebunch wheatgrassSub-dominant:
Remaining grass species > Remaining shrub speciesOther:
Additional:
-
Amount of plant mortality and decadence (include which functional groups are expected to show mortality or decadence):
Mortality in herbaceous species is not evident. Species with bunch growth forms may have some natural mortality in centers. Sagebrush species will become decadent in the absence of historical fire return intervals. -
Average percent litter cover (%) and depth ( in):
-
Expected annual annual-production (this is TOTAL above-ground annual-production, not just forage annual-production):
Annual production ranges from 550 - 800 lbs/acre, averaging 675 lbs/per acre. Production varies based on effective precipitation and natural variability of soil properties for this ecological site. Total production is slightly higher for shrub species than grass species, but tends to be split mostly equal between grasses and shrubs. -
Potential invasive (including noxious) species (native and non-native). List species which BOTH characterize degraded states and have the potential to become a dominant or co-dominant species on the ecological site if their future establishment and growth is not actively controlled by management interventions. Species that become dominant for only one to several years (e.g., short-term response to drought or wildfire) are not invasive plants. Note that unlike other indicators, we are describing what is NOT expected in the reference state for the ecological site:
Potential invasive species include cheatgrass, spotted knapweed, toadflax, and crested wheatgrass. Native species such a yellow rabbitbrush or significant populations of Sandberg bluegrass or rhizomatous wheatgrasses can indicate a departure from the reference state. -
Perennial plant reproductive capability:
All functional groups have the potential to reproduce in most years. Bluebunch wheatgrass may not reproduce during extended periods of drought.
Print Options
Sections
Font
Other
The Ecosystem Dynamics Interpretive Tool is an information system framework developed by the USDA-ARS Jornada Experimental Range, USDA Natural Resources Conservation Service, and New Mexico State University.
Click on box and path labels to scroll to the respective text.