Natural Resources
Conservation Service
Ecological site BX013X01G178
Wetland Bear River Valley
Last updated: 5/06/2025
Accessed: 05/19/2025
General information
Provisional. A provisional ecological site description has undergone quality control and quality assurance review. It contains a working state and transition model and enough information to identify the ecological site.
MLRA notes
Major Land Resource Area (MLRA): 013X–Eastern Idaho Plateaus
Major Land Resource Area (MLRA): 013X–Eastern Idaho Plateaus
Major Land Resource Area (MLRA) 13, Eastern Idaho Plateaus, consists of approximately five million acres in Idaho with a small part in Utah and Wyoming. It consists of six Land Resource Units (LRU). These units are divisions of the MLRA based on geology, landscape, common soils, water resources and plant community potentials. The elevation ranges from approximately 4,500 to 6,600 feet (1,370 to 2,010 m) on the plateaus and foothills to as much as 9,500 feet (2,895 m) on the mountains. Annual precipitation ranges from 10 to 48 inches (254 to 1,220 mm), with the driest areas in the Bear River Valley on the far eastern portion and the wettest areas on the mountain summits. The Fort Hall Indian Reservation and several national forests are in this MLRA, including the Caribou, Cache, and Targhee National Forests. Yellowstone and Grand Teton National Parks occur just outside the northeast boundary.
LRU notes
The Bear River Valley LRU is located on the far eastern side of MLRA 13 between the Bear River Divide and the Monte Cristo Range, from Woodruff, Utah at the southern end to Cokeville, Wyoming at the northern end. The total area of the LRU is approximately 340,000 acres. It shares a boundary with MLRA 47 - Wasatch and Uinta Mountains, 43B - Central Rocky Mountains, and 46 - Northern Rocky Mountain Foothills (proposed in Wyoming).
This LRU differs from the others in its geology, which is consists mostly of alluvium and colluvium from the Stump Formation. Its weather patterns are such that the soil moisture regime is xeric, meaning there is a slight peak in winter precipitation in this LRU, with typical yearly precipitation between 10 and 15 inches (254-380 mm). The soil temperature regime of this LRU is frigid with mean annual soil temperatures ranging from 44 to 48 degrees Fahrenheit (6.7 to 8.8 C). The elevation range is from 5,700 to 7,000 feet (1,730 to 2,130 m). The soils in the Bear River Valley are dominated by young, very deep soils developed from sandstone and shale parent material re-worked with recent alluvium. Soils are dominated by Alfisols with young argillic horizons and by Fluvents in more recent alluvium.
The Bear River runs through this LRU, allowing for ample amounts of irrigation water used in the lowland areas to produce hay with smaller tributaries originating from the neighboring mountains.
Classification relationships
Relationship to Other Established Classification Systems
National Vegetation Classification System (NVC):
5 Aquatic Vegetation Class
5.B Freshwater Aquatic Vegetation Subclass
5.B.2 Na North American Freshwater Aquatic Vegetation Macrogroup
M109 Western North American Freshwater Aquatic Vegetation Group
G544 Western North American Temperate Freshwater Aquatic Vegetation Group
Ecoregions (EPA):
Level I: 10 North American Deserts
Level II: 10.1 Cold Deserts
Level III: 10.1.4 Wyoming Basin
Ecological site concept
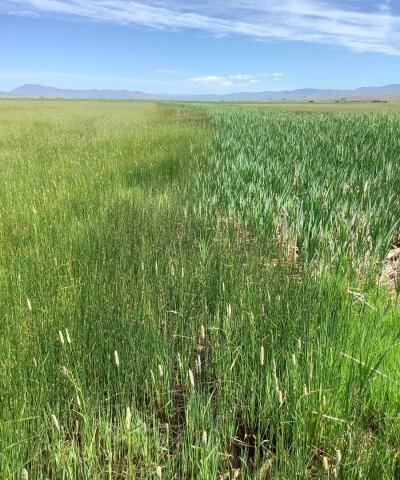
The wetland ecological site in the Bear River Valley is a site that receives additional moisture in addition to annual precipitation. The site is found in flood plains along the bear river and other adjacent riverine systems. The site is not limited by soil chemistry.
This site:
o Is in a lowland position and receives significant additional moisture from runoff, streams, or a high water table
o Has a water table within rooting depth of herbaceous species - 12 to 24 inches.
Associated sites
| BX013X01B024 |
Loamy Argillic Bear River Valley 10-14" P.Z. This site can occur on terraces and adjacent hillslopes. |
|---|---|
| BX013X01B142 |
Saline Subirrigated Bear River Valley 10-14" P.Z. This site can occur in slightly drier locations adjacent to the floodplains where the Wetland Ecological Site can be found. |
| BX013X01B174 |
Subirrigated Bear River Valley This site can occur in slightly drier locations adjacent to the floodplains where the Wetland Ecological Site can be found. |
Similar sites
| BX013X01B142 |
Saline Subirrigated Bear River Valley 10-14" P.Z. This site also has a water table, however it is seasonal and at a depth of 20-40 inches. This ecological site is also moderately to strongly saline. |
|---|---|
| BX013X01B174 |
Subirrigated Bear River Valley This site has a seasonal water table of 20-40 inches. |
| BX013X01B030 |
Overflow Bear River Valley 10-14" P.Z. This site receives additional moisture outside of annual precipitation, however it is only from overland flow and is located in drainage landforms. |
Table 1. Dominant plant species
| Tree |
Not specified |
|---|---|
| Shrub |
Not specified |
| Herbaceous |
(1) Carex nebrascensis |
Legacy ID
R013XA178WY
Physiographic features
This site occurs on floodplain, stream terrace and meander scroll landforms at elevations between 6,000 and 6,600 feet. This site occurs on all aspects. The slopes range from level to two percent. Flooding and ponding may occur on this site.
Table 2. Representative physiographic features
| Landforms |
(1)
Mountain valleys or canyons
> Flood plain
(2) Stream terrace (3) Meander scroll |
|---|---|
| Flooding frequency | Occasional to frequent |
| Elevation | 6,000 – 6,600 ft |
| Slope | 2% |
| Water table depth | 12 – 24 in |
| Aspect | W, NW, N, NE, E, SE, S, SW |
Table 3. Representative physiographic features (actual ranges)
| Flooding frequency | Rare to frequent |
|---|---|
| Elevation | Not specified |
| Slope | Not specified |
| Water table depth | Not specified |
Climatic features
Annual precipitation in the Bear River Valley ranges from 10 to 14 inches per year. Wide fluctuations may occur in yearly precipitation and result in more below-average years than those with above average precipitation. Temperatures show a wide range between summer and winter and between daily maximums and minimums. This is predominantly due to the high elevation and dry air, which permits rapid incoming and outgoing radiation. Cold air outbreaks in winter move rapidly from northwest to southeast and account for extreme minimum temperatures. Roughly 25 to 30 percent of the precipitation occurs during the critical growth period, but the majority of precipitation accumulates outside the growing season, creating xeric-like conditions. The wettest rainfall month is May. The dominant plants (sagebrush and cool-season grasses) are well adapted to these conditions. Daytime winds are generally stronger than nighttime and occasional strong storms may bring brief periods of high winds with gusts to more than 50 mph. The growing season is short (60 to 90 days) and cool (critical growth period): primary growth typically occurs between May and June. Growth of native cool-season plants begins about mid-April and continues to approximately early July. Some green-up of cool-season plants usually occurs in September with adequate fall moisture.
All data is based on the 30 year average from 1981 through 2010.
Table 4. Representative climatic features
| Frost-free period (characteristic range) | 10-57 days |
|---|---|
| Freeze-free period (characteristic range) | 44-105 days |
| Precipitation total (characteristic range) | 10-13 in |
| Frost-free period (actual range) | 4-75 days |
| Freeze-free period (actual range) | 30-122 days |
| Precipitation total (actual range) | 10-13 in |
| Frost-free period (average) | 35 days |
| Freeze-free period (average) | 75 days |
| Precipitation total (average) | 11 in |
Figure 1. Monthly precipitation range
Figure 2. Monthly minimum temperature range
Figure 3. Monthly maximum temperature range
Figure 4. Monthly average minimum and maximum temperature
Figure 5. Annual precipitation pattern
Figure 6. Annual average temperature pattern
Climate stations used
-
(1) SAGE 4 NNW [USC00487955], Cokeville, WY
-
(2) LIFTON PUMPING STN [USC00105275], Montpelier, ID
-
(3) RANDOLPH [USC00427165], Randolph, UT
Influencing water features
This ecological site receives additional moisture in the form of runoff from surrounding uplands, seasonal flooding (both natural and anthropogenic), and groundwater tables from the riverine system. The water table does not fluctuate outside of 12 to 24 inches throughout the year.
Wetland description
This ecological site falls into the following Cowardin wetland classifications:
PEM1C - Palustrine Emergent Persistent - Seasonally flooded
PEM1F - Palustrine Emergent Persistent - Semi-permanently flooded
PEM1A - Palustrine Emergent Persistent - Temporary flooded
Soil features
Soils on this site consist of very deep, poorly drained soils that formed through alluvial processes. The soils primarily exist in floodplains but can also be found on stream terraces, oxbows, and meander scrolls. The soils have a frigid temperature regime and an aquic moisture regime.
The erosion hazard is slight. The peaty and high organic soils tend to hummock severely from trampling. These soils are susceptible to gully formation which intercepts normal overflow patterns and results in site degradation. The water table is at or near the surface for most of the growing season. Flooding is rare to frequent during snowmelt and just after snowmelt. Ponding can occur in small depression areas during this time period. The plant community is dependent on nearly saturated or saturated soils during a major portion of the growing season. The water table is influenced by seasonal flooding, stream flows, seeps or springs, or from run-on from adjacent sites. Soil characteristics, flooding, and water table can vary within a landscape delineation.
Soil series correlated to this site: Saria, Dampe, and Sueker
Table 5. Representative soil features
| Parent material |
(1)
Alluvium
|
|---|---|
| Surface texture |
(1) Peaty, mucky loam (2) Loam (3) Sandy clay loam |
| Drainage class | Poorly drained |
| Permeability class | Moderately slow |
| Soil depth | 20 – 60 in |
| Available water capacity (0-20in) |
2.42 – 3.86 in |
| Soil reaction (1:1 water) (0-20in) |
7.3 – 8.4 |
| Subsurface fragment volume <=3" (0-15in) |
Not specified |
| Subsurface fragment volume >3" (0-5in) |
Not specified |
Table 6. Representative soil features (actual values)
| Drainage class | Poorly drained to somewhat poorly drained |
|---|---|
| Permeability class | Moderately slow to moderate |
| Soil depth | 20 – 60 in |
| Available water capacity (0-20in) |
1.18 – 4.94 in |
| Soil reaction (1:1 water) (0-20in) |
6.8 – 8.5 |
| Subsurface fragment volume <=3" (0-15in) |
Not specified |
| Subsurface fragment volume >3" (0-5in) |
Not specified |
Ecological dynamics
A state-and-transition model (STM) diagram is depicted in this section. Thorough descriptions of each state, transition, plant community phase, and pathway are found after the model in this document. This diagram is based on available experimental research, field observations, professional consensus, and interpretations. While based on the best available information, the STM will change over time as knowledge of ecological processes increases.
Plant community composition within the same ecological site has a natural range of variability across the LRU due to the naturally occurring variability in weather, soils, and aspect. Not all managers will choose the Reference Plant Community as the management goal. Other plant communities may be desired to meet land management objectives. This is valid as long as the rangeland health attributes assessment departures are none to slight or slight to moderate from the Reference state. The biological processes on this site are complex; therefore, representative values are presented in a land management context. The species lists are representative and are not botanical descriptions of all species occurring, or potentially occurring, on this site. They are not intended to cover every situation or the full range of conditions, species, and responses for the site.
Both percent species composition by weight and percent cover are used in this ESD. Most observers find it easier to visualize or estimate percent cover for woody species (trees and shrubs). Foliar cover is used to define plant community phases and states in the state-and-transition model. Cover drives the transitions between communities and states because of the influence of shade and interception of rainfall.
Species composition by dry weight remains an important descriptor of the herbaceous community and of site productivity as a whole and includes both herbaceous and woody species. Calculating similarity index requires data on species composition by dry weight.
Although there is considerable qualitative experience supporting the pathways and transitions within the state-and-transition model, no quantitative information exists that specifically identifies threshold parameters between Reference state and Degraded state in this ecological site.
State and transition model
More interactive model formats are also available.
View Interactive Models
Click on state and transition labels to scroll to the respective text
Ecosystem states
State 1 submodel, plant communities
State 2 submodel, plant communities
State 3 submodel, plant communities
State 1
Reference
The Reference state consists of two communities: the Rush community and the Sedge community. Each plant community differs in percent composition and foliar cover of rushes, sedges, other grasses, and forbs. The dominant species found in the rush community are common spikerush (Eleocharis palustris) and hardstem bulrush (Schoenoplectus acutus). Two important processes occur in the reference state and result in community changes: 1) changes to the hydrologic regime; and 2) disturbances such as herbivory and drought.
Characteristics and indicators. Community occurrence as well as shifts between communities is a result of localized variation in the hydrology or changes in the hydrology due to disturbance. Sites with the water table closer to the surface or inundated for longer periods of time are more likely to result in the bulrush dominated community. Sites with a deeper water table or sites that are less to intermittent flooding are more likely to show characteristics of the sedge community.
Resilience management. Resilience of this ecological site is strongly tied to hydrologic function. When the hydologic system is functioning properly, resilience is high. If changes in the hydrologic regime occur due to natural or anthropogenic disturbances. Resilience decreases.
Dominant plant species
-
Nebraska sedge (Carex nebrascensis), grass
-
hardstem bulrush (Schoenoplectus acutus), grass
-
common spikerush (Eleocharis palustris), grass
-
aster (Symphyotrichum), other herbaceous
-
field horsetail (Equisetum arvense), other herbaceous
-
Rocky Mountain iris (Iris missouriensis), other herbaceous
Community 1.1
Rush
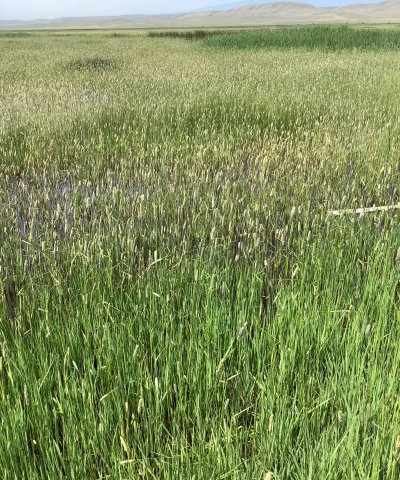
This plant community is well adapted to the aquic conditions present in the Reference state. The rush community can occur homogenously across the ecological site or in a mosaic with other plants, depending on localized conditions. This community is more likely to occur where wetter conditions or higher water tables exist for longer periods of time. Canopy cover of rushes can vary significantly, ranging from 45 to 90 percent. Production in this community is high and can range from 2,500 to 4,500 pounds per acre. Competition can exist between the dominant rushes and other sedges, grasses, and forbs in dense canopies. For this community to remain within the Reference state, invasive species canopy cover must remain below 10 percent total, and not exceed five percent for any given species.
Dominant plant species
-
willow (Salix), shrub
-
common spikerush (Eleocharis palustris), grass
-
hardstem bulrush (Schoenoplectus acutus), grass
-
field horsetail (Equisetum arvense), other herbaceous
-
Rocky Mountain iris (Iris missouriensis), other herbaceous
-
aster (Symphyotrichum), other herbaceous
Figure 7. Annual production by plant type (representative values) or group (midpoint values)
Table 7. Annual production by plant type
| Plant type | Low (lb/acre) |
Representative value (lb/acre) |
High (lb/acre) |
|---|---|---|---|
| Grass/Grasslike | 1800 | 3000 | 4200 |
| Forb | 50 | 150 | 300 |
| Shrub/Vine | 0 | 0 | 200 |
| Total | 1850 | 3150 | 4700 |
Table 8. Ground cover
| Tree foliar cover | 0% |
|---|---|
| Shrub/vine/liana foliar cover | 0-15% |
| Grass/grasslike foliar cover | 50-80% |
| Forb foliar cover | 0-5% |
| Non-vascular plants | 0% |
| Biological crusts | 0% |
| Litter | 3-10% |
| Surface fragments >0.25" and <=3" | 0% |
| Surface fragments >3" | 0% |
| Bedrock | 0% |
| Water | 0% |
| Bare ground | 0-5% |
Table 9. Soil surface cover
| Tree basal cover | 0% |
|---|---|
| Shrub/vine/liana basal cover | 0-15% |
| Grass/grasslike basal cover | 60-85% |
| Forb basal cover | 3-10% |
| Non-vascular plants | 0% |
| Biological crusts | 0% |
| Litter | 55-95% |
| Surface fragments >0.25" and <=3" | 0% |
| Surface fragments >3" | 0% |
| Bedrock | 0% |
| Water | 0% |
| Bare ground | 0-5% |
Figure 8. Plant community growth curve (percent production by month). ID0915, Wet Meadow.
| Jan | Feb | Mar | Apr | May | Jun | Jul | Aug | Sep | Oct | Nov | Dec |
|---|---|---|---|---|---|---|---|---|---|---|---|
| J | F | M | A | M | J | J | A | S | O | N | D |
| 0 | 0 | 0 | 5 | 20 | 20 | 25 | 20 | 10 | 0 | 0 | 0 |
Community 1.2
Sedge
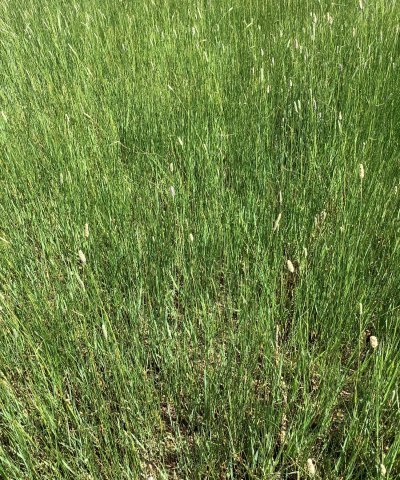
The sedge community is well suited the abiotic conditions of the Wetland ecological site. The dominant plant is Nebraska sedge (Carex nebrascensis), which can exceed 50 percent canopy cover. The remainder of the canopy is interspersed by other grasses, including tufted hairgrass (Deschampsia cespitosa), American mannagrass (Glyceria grandis), and reedgrass (Calamagrostis spp.) among others. Rushes can also occupy space in the vegetative canopy, but to a lesser extent. Production for this site averages approximately 3,000 pounds per acre but will range from 2,000 to 4,500 pounds per acre across the range of variability. This community tends to occur more frequently in the slightly drier locations of this ecological site (the wetter being more favorable to community 1.1). This community evolved with grazing by large herbivores and is well suited for low to moderate grazing pressure.
Resilience management. This ecological site has high resilience as long as the hydrology of the site is functioning properly. The hydrology of this site makes it resistant to drought as water remains available to plants on site. If the hydrologic function is altered, the site becomes increasingly susceptible to community change and invasive species establishment.
Dominant plant species
-
willow (Salix), shrub
-
water birch (Betula occidentalis), shrub
-
Nebraska sedge (Carex nebrascensis), grass
-
tufted hairgrass (Deschampsia cespitosa), grass
-
reedgrass (Calamagrostis), grass
-
aster (Symphyotrichum), other herbaceous
-
cinquefoil (Potentilla), other herbaceous
-
Rocky Mountain iris (Iris missouriensis), other herbaceous
Figure 9. Annual production by plant type (representative values) or group (midpoint values)
Table 10. Annual production by plant type
| Plant type | Low (lb/acre) |
Representative value (lb/acre) |
High (lb/acre) |
|---|---|---|---|
| Grass/Grasslike | 1000 | 1500 | 3000 |
| Forb | 150 | 350 | 550 |
| Shrub/Vine | 0 | 0 | 350 |
| Total | 1150 | 1850 | 3900 |
Table 11. Ground cover
| Tree foliar cover | 0% |
|---|---|
| Shrub/vine/liana foliar cover | 0-15% |
| Grass/grasslike foliar cover | 50-80% |
| Forb foliar cover | 0-5% |
| Non-vascular plants | 0% |
| Biological crusts | 0% |
| Litter | 3-10% |
| Surface fragments >0.25" and <=3" | 0% |
| Surface fragments >3" | 0% |
| Bedrock | 0% |
| Water | 0% |
| Bare ground | 0-5% |
Table 12. Soil surface cover
| Tree basal cover | 0% |
|---|---|
| Shrub/vine/liana basal cover | 0-15% |
| Grass/grasslike basal cover | 60-85% |
| Forb basal cover | 3-10% |
| Non-vascular plants | 0% |
| Biological crusts | 0% |
| Litter | 55-95% |
| Surface fragments >0.25" and <=3" | 0% |
| Surface fragments >3" | 0% |
| Bedrock | 0% |
| Water | 0% |
| Bare ground | 0-5% |
Figure 10. Plant community growth curve (percent production by month). ID0314, Wet Meadow. State 1, Reference Plant Community Phase.
| Jan | Feb | Mar | Apr | May | Jun | Jul | Aug | Sep | Oct | Nov | Dec |
|---|---|---|---|---|---|---|---|---|---|---|---|
| J | F | M | A | M | J | J | A | S | O | N | D |
| 0 | 0 | 0 | 5 | 15 | 20 | 30 | 20 | 10 | 0 | 0 | 0 |
Pathway 1.1A
Community 1.1 to 1.2
The transition from Community 1.1 to Community 1.2 is based on localized abiotic conditions relating to moisture availability. When the average water table depth is lower in the soil profile and less water is available at rooting depth, transition to Community 1.2 occurs. The plant species present in Community 1.2 are better suited to the slightly drier conditions.
Context dependence. Water tables fluctuate throughout the seasons and can be impacted by management. Plant composition is a result of average water table depth over time.
State 2
Invaded
The invaded state is a result of a disturbance related change (natural or anthropogenic) accompanied by immigration of non-native plant species. With this ecological site, the two primary drivers for this state are abnormal changes to the hydrologic cycle and intensive or continuous grazing. When the hydrologic regime of the site is interrupted or altered, native vegetation may decrease in canopy cover. These openings create opportunities for invasive species establishment. The process is similar for intensive or continuous grazing. When native vegetation is grazed beyond the threshold for reasonable recovery, invasive species take advantage of the lack of competition from native vegetation, aiding in establishment. Common indicator species of this state include meadow foxtail (Alopecurus pratensis), reed canarygrass (Phalaris arundinacea), Canada thistle (cirsium arvense), Timothy (Phleum pratense) and water hemlock (Cicuta sp.). These species often intermix with native sedges, rushes, and forbs found in the reference state.
Characteristics and indicators. This state and community is dependent on disturbances that decrease canopy cover of native vegetation. Once canopy openings exist, the state and community generally perpetuate, regardless of conditions post disturbance. Once established, invasive species are difficult to eradicate even through mechanical and chemical treatments. This state and community is identified by greater than five percent canopy cover for any one invasive species or a cumulative canopy cover is greater than 15 percent for all invasive species.
Resilience management. This state and community is highly resilient in that once established, disturbance only further perpetuates the composition and canopy cover.
Dominant plant species
-
willow (Salix), shrub
-
water birch (Betula occidentalis), shrub
-
meadow foxtail (Alopecurus pratensis), grass
-
reed canarygrass (Phalaris arundinacea), grass
-
timothy (Phleum pratense), grass
-
curly dock (Rumex crispus), other herbaceous
-
aster (Symphyotrichum), other herbaceous
-
cinquefoil (Potentilla), other herbaceous
Community 2.1
Invasive Grasses
This plant community is a result of disturbances (natural or anthropogenic) that reduce native plant cover and create opportunities for invasive species establishment. The primary disturbances leading to this community include any disturbance that alters the hydrologic regime or grazing practices that exceed what is supported by the natural vegetation. Species such as meadow foxtail, reed canarygrass, and Canada thistle tend to dominate this community. The production of this community is wide-ranging and highly dependent on the composition of invasive and native species present. The low end of production can be as low as 1,500 pounds per acre and can exceed 5,000 pounds per acre under certain conditions and plant compositions.
Dominant plant species
-
willow (Salix), shrub
-
water birch (Betula occidentalis), shrub
-
meadow foxtail (Alopecurus pratensis), grass
-
reed canarygrass (Phalaris arundinacea), grass
-
timothy (Phleum pratense), grass
-
Canada thistle (Cirsium arvense), other herbaceous
-
curly dock (Rumex crispus), other herbaceous
Figure 11. Annual production by plant type (representative values) or group (midpoint values)
Table 13. Annual production by plant type
| Plant type | Low (lb/acre) |
Representative value (lb/acre) |
High (lb/acre) |
|---|---|---|---|
| Grass/Grasslike | 1500 | 3500 | 5200 |
| Forb | 50 | 150 | 300 |
| Shrub/Vine | 0 | 0 | 200 |
| Total | 1550 | 3650 | 5700 |
Table 14. Ground cover
| Tree foliar cover | 0% |
|---|---|
| Shrub/vine/liana foliar cover | 0-15% |
| Grass/grasslike foliar cover | 35-80% |
| Forb foliar cover | 0-8% |
| Non-vascular plants | 0% |
| Biological crusts | 0% |
| Litter | 2-10% |
| Surface fragments >0.25" and <=3" | 0% |
| Surface fragments >3" | 0% |
| Bedrock | 0% |
| Water | 0% |
| Bare ground | 0-5% |
Table 15. Soil surface cover
| Tree basal cover | 0% |
|---|---|
| Shrub/vine/liana basal cover | 0-15% |
| Grass/grasslike basal cover | 30-85% |
| Forb basal cover | 3-10% |
| Non-vascular plants | 0% |
| Biological crusts | 0% |
| Litter | 55-95% |
| Surface fragments >0.25" and <=3" | 0% |
| Surface fragments >3" | 0% |
| Bedrock | 0% |
| Water | 0% |
| Bare ground | 0-5% |
Figure 12. Plant community growth curve (percent production by month). ID0314, Wet Meadow. State 1, Reference Plant Community Phase.
| Jan | Feb | Mar | Apr | May | Jun | Jul | Aug | Sep | Oct | Nov | Dec |
|---|---|---|---|---|---|---|---|---|---|---|---|
| J | F | M | A | M | J | J | A | S | O | N | D |
| 0 | 0 | 0 | 5 | 15 | 20 | 30 | 20 | 10 | 0 | 0 | 0 |
State 3
Reflooded
This state exists when the Wetland ecological site has been previously drained or had the hydrologic regime altered for an extended period of time, followed by the hydrologic regime being restored. In this LRU, hydrologic conditions are often altered for agricultural benefit. Overtime, these altered sites can no longer support much of the vegetation at the composition and structure found in the Reference state. Loss of Reference state vegetation can result in a transition to the Invaded state as invasive species are able to take advantage of the openings and disturbed conditions. If the hydrologic regime is altered severely and the seasonal water table is significantly changed, this could become a new ecological site. Returning a site's hydrologic conditions to those of the Reference state after these conditions have remained altered for an extended period of time results in the Reflooded state. Following reflooding, this site tends to quickly recolonize with species that are able to quickly take advantage of the conditions and lack of competition.
Characteristics and indicators. This site is characterized by a lack of plant diversity. In the early years after reflooding, this site can become nearly a monoculture of species that are able to take advantage of site conditions. The primary species to establish at this site is meadow foxtail (Alopecurus pratensis). This species can occupy as much as 90 percent of the overstory canopy and contribute to over 95 percent of the sites total production. Production in this state is high, ranging from 3,000 to 6,000 lbs/acre, averaging 5,000 lbs/acre.
Resilience management. The Reflooded state has moderate resilience. The species found in this state are colonizing species able to adapt well to a wide variety of conditions and disturbances. The lack of diversity in this state decreases resilience, lowering the ability to tolerate certain events that impact the main species.
Dominant plant species
-
willow (Salix), shrub
-
water birch (Betula occidentalis), shrub
-
meadow foxtail (Alopecurus pratensis), grass
-
western mountain aster (Symphyotrichum spathulatum), other herbaceous
-
alpine leafybract aster (Symphyotrichum foliaceum), other herbaceous
Community 3.1
Monoculture Grass
This community is identified by a monoculture of meadow foxtail in the overstory. Once a site is reflooded and the historic hydrologic regime returned, meadow foxtail is able to quickly establish and take advantage of the lack of competition. Other grasses, sedges, and rushes can establish in small numbers. The understory is occupied by forbs with low canopy numbers, primarily western and leafy bract asters (Symphyotrichum spp.). Plant production is high, from approximately 3,000 to 6,000 pounds per acre, with an average of 5,000 pounds per acre.
Resilience management. This community has moderate resilience. The species that occupy this site are adaptable to a wide variety of conditions, however, the lack of diversity lowers the resilience. These communities are also prone to additional establishment by invasive species due to the lack of established native vegetation.
Dominant plant species
-
willow (Salix), shrub
-
water birch (Betula occidentalis), shrub
-
meadow foxtail (Alopecurus pratensis), grass
-
alpine leafybract aster (Symphyotrichum foliaceum), other herbaceous
-
western mountain aster (Symphyotrichum spathulatum), other herbaceous
Figure 13. Annual production by plant type (representative values) or group (midpoint values)
Table 16. Annual production by plant type
| Plant type | Low (lb/acre) |
Representative value (lb/acre) |
High (lb/acre) |
|---|---|---|---|
| Grass/Grasslike | 2500 | 4500 | 5500 |
| Forb | 150 | 350 | 550 |
| Shrub/Vine | 0 | 0 | 350 |
| Total | 2650 | 4850 | 6400 |
Table 17. Ground cover
| Tree foliar cover | 0% |
|---|---|
| Shrub/vine/liana foliar cover | 0-15% |
| Grass/grasslike foliar cover | 60-90% |
| Forb foliar cover | 0-8% |
| Non-vascular plants | 0% |
| Biological crusts | 0% |
| Litter | 0-8% |
| Surface fragments >0.25" and <=3" | 0% |
| Surface fragments >3" | 0% |
| Bedrock | 0% |
| Water | 0% |
| Bare ground | 0-10% |
Table 18. Soil surface cover
| Tree basal cover | 0% |
|---|---|
| Shrub/vine/liana basal cover | 0-15% |
| Grass/grasslike basal cover | 65-92% |
| Forb basal cover | 3-10% |
| Non-vascular plants | 0% |
| Biological crusts | 0% |
| Litter | 40-75% |
| Surface fragments >0.25" and <=3" | 0% |
| Surface fragments >3" | 0% |
| Bedrock | 0% |
| Water | 0% |
| Bare ground | 0-7% |
Transition T1A
State 1 to 2
The transition from the Reference state to the Invaded state is disturbance-driven. Any natural or anthropogenic disturbance that impacts the hydrologic regime or canopy cover of native vegetation can trigger a transition to the invaded state. Reduction in native, Reference state vegetation removes competition and promotes the establishment of invasive more adapted to the post-disturbance conditions. Primary disturbances generally result from agricultural practices, including activities that alter the hydrology of the ecological site.
Constraints to recovery. Constraints to recovery include loss of hydrologic function for the site and the establishment of invasive species. Without restoration of the previous hydrologic processes, the site would not be able to return to the Reference state. Once invasive species are established, removal to promote regrowth of reference vegetation would be costly and difficult.
Context dependence. Restoration likelihood is dependent on the ability to restore the hydrologic regime and level of invasive species establishment.
Restoration pathway R2A
State 2 to 1
Restoration from the Invaded state to the Reference state requires restoration of hydrologic function and removal of invasive species. Restoration of hydrology includes returning the depth and duration of historic, seasonal water tables. Removal of invasive species can be achieved through mechanical and chemical treatments, targeted grazing, or a combination of the three. Success of invasive species removal is improved if native species are planted or seeded after treatment.
Context dependence. Restoration success is dependent on the ability to restore hydrologic function a level of invasive species establishment. Time without further disturbance also increases restoration success.
Transition T2A
State 2 to 3
The transition from the Invaded state to the Reflooded state occurs when historic hydrologic regimes and seasonal water table depths (and durations) are are restored at the ecological site.
Constraints to recovery. The primary constraints to recovery are time since the site's hydrology had been altered and the ability to fully restore hydrologic regimes. Over time, sites that have been drained or disturbed lose native vegetation and increase in invasive species cover. The longer this time period, the more difficult it becomes to restore the site to reference.
Context dependence. Although hydrologic conditions may have been restored, plant composition and canopy cover may be dominated or shared with invasive species. Management objectives and species present may direct which state this site is correlated to for management decisions.
Restoration pathway R3A
State 3 to 1
Restoration from the Reflooded state to the Reference state occurs when the site's hydrologic regime is restored and the plant canopy cover and composition resembles that of the Reference state communities. In addition to restoring hydrologic regimes, it may be necessary for mechanical treatments to remove unwanted invasive species as well as planting on Reference state plants.
Context dependence. Success of restoration from the Reflooded to the Reference state is highly dependent on vegetation composition and canopy cover. Sites with a significant presence of undesired invasive species will take more resources and time for restoration to occur.
Transition T3A
State 3 to 2
The transition from the Reflooded state to the Invaded state occurs when unwanted invasive species establish and contribute to 10 percent or more of the total canopy cover after a site has been reflooded. If much of the Reference state vegetation was lost because of a lack of function in the hydrologic regime, this transition to the Invaded state can occur quickly once reflooding has taken place. Many of the common invasive species at this ecological site are able to quickly establish when a lack of competition from native vegetation exists.
Constraints to recovery. Constraints to recovery include the level of invasive species establishment as well as resources available for mechanical treatments and post-treatment reseeding.
Context dependence. After reflooding, sites in this LRU often repopulate with meadow foxtail, which is considered invasive. Depending on management objectives, meadow foxtail may not be considered undesirable and this site, in this condition, could remain in the Reflooded state.
Additional community tables
Table 19. Community 1.1 plant community composition
| Group | Common name | Symbol | Scientific name | Annual production (lb/acre) | Foliar cover (%) | |
|---|---|---|---|---|---|---|
|
Grass/Grasslike
|
||||||
| 1 | 1500–4500 | |||||
| hardstem bulrush | SCAC3 | Schoenoplectus acutus | 700–3000 | 15–90 | ||
| common spikerush | ELPA3 | Eleocharis palustris | 700–3000 | 15–85 | ||
| Nebraska sedge | CANE2 | Carex nebrascensis | 100–600 | 5–20 | ||
| sedge | CAREX | Carex | 0–250 | 0–10 | ||
| tufted hairgrass | DECE | Deschampsia cespitosa | 0–200 | 0–8 | ||
| reedgrass | CALAM | Calamagrostis | 0–200 | 0–8 | ||
| mountain rush | JUARL | Juncus arcticus ssp. littoralis | 0–150 | 0–8 | ||
| foxtail barley | HOJU | Hordeum jubatum | 0–150 | 0–7 | ||
| meadow foxtail | ALPR3 | Alopecurus pratensis | 0–150 | 0–5 | ||
| marsh arrowgrass | TRPA28 | Triglochin palustris | 0–100 | 0–5 | ||
| alpine timothy | PHAL2 | Phleum alpinum | 0–100 | 0–5 | ||
| reed canarygrass | PHAR3 | Phalaris arundinacea | 0–100 | 0–5 | ||
| American mannagrass | GLGR | Glyceria grandis | 0–100 | 0–5 | ||
|
Forb
|
||||||
| 2 | 50–400 | |||||
| snowberry | SYMPH | Symphoricarpos | 0–200 | 0–8 | ||
| cinquefoil | POTEN | Potentilla | 0–200 | 0–8 | ||
| field horsetail | EQAR | Equisetum arvense | 0–200 | 0–7 | ||
| Rocky Mountain iris | IRMI | Iris missouriensis | 0–150 | 0–5 | ||
| bedstraw | GALIU | Galium | 0–150 | 0–5 | ||
| silverweed cinquefoil | ARAN7 | Argentina anserina | 0–150 | 0–5 | ||
|
Shrub/Vine
|
||||||
| 3 | 0–300 | |||||
| willow | SALIX | Salix | 0–250 | 0–10 | ||
| water birch | BEOC2 | Betula occidentalis | 0–200 | 0–8 | ||
Table 20. Community 1.2 plant community composition
| Group | Common name | Symbol | Scientific name | Annual production (lb/acre) | Foliar cover (%) | |
|---|---|---|---|---|---|---|
|
Shrub/Vine
|
||||||
| 1 | 0–400 | |||||
| willow | SALIX | Salix | 0–250 | 0–10 | ||
| water birch | BEOC2 | Betula occidentalis | 0–200 | 0–8 | ||
|
Grass/Grasslike
|
||||||
| 2 | 1000–1800 | |||||
| Nebraska sedge | CANE2 | Carex nebrascensis | 450–1800 | 10–65 | ||
| hardstem bulrush | SCAC3 | Schoenoplectus acutus | 0–1500 | 0–30 | ||
| common spikerush | ELPA3 | Eleocharis palustris | 0–1500 | 0–30 | ||
| sedge | CAREX | Carex | 50–500 | 2–20 | ||
| tufted hairgrass | DECE | Deschampsia cespitosa | 0–200 | 0–8 | ||
| reedgrass | CALAM | Calamagrostis | 0–200 | 0–8 | ||
| mountain rush | JUARL | Juncus arcticus ssp. littoralis | 0–150 | 0–8 | ||
| foxtail barley | HOJU | Hordeum jubatum | 0–150 | 0–7 | ||
| alpine timothy | PHAL2 | Phleum alpinum | 0–150 | 0–5 | ||
| meadow foxtail | ALPR3 | Alopecurus pratensis | 0–150 | 0–5 | ||
| reed canarygrass | PHAR3 | Phalaris arundinacea | 0–100 | 0–5 | ||
| American mannagrass | GLGR | Glyceria grandis | 0–100 | 0–5 | ||
| marsh arrowgrass | TRPA28 | Triglochin palustris | 0–100 | 0–5 | ||
|
Forb
|
||||||
| 3 | 100–600 | |||||
| snowberry | SYMPH | Symphoricarpos | 0–200 | 0–8 | ||
| field horsetail | EQAR | Equisetum arvense | 0–200 | 0–7 | ||
| cinquefoil | POTEN | Potentilla | 0–150 | 0–5 | ||
| Rocky Mountain iris | IRMI | Iris missouriensis | 0–150 | 0–5 | ||
| bedstraw | GALIU | Galium | 0–150 | 0–5 | ||
Table 21. Community 2.1 plant community composition
| Group | Common name | Symbol | Scientific name | Annual production (lb/acre) | Foliar cover (%) | |
|---|---|---|---|---|---|---|
|
Shrub/Vine
|
||||||
| 1 | – | |||||
| willow | SALIX | Salix | 0–250 | 0–10 | ||
| water birch | BEOC2 | Betula occidentalis | 0–200 | 0–8 | ||
|
Grass/Grasslike
|
||||||
| 2 | – | |||||
| meadow foxtail | ALPR3 | Alopecurus pratensis | 350–4000 | 8–80 | ||
| reed canarygrass | PHAR3 | Phalaris arundinacea | 0–1100 | 0–30 | ||
| hardstem bulrush | SCAC3 | Schoenoplectus acutus | 0–350 | 0–15 | ||
| common spikerush | ELPA3 | Eleocharis palustris | 0–300 | 0–15 | ||
| Nebraska sedge | CANE2 | Carex nebrascensis | 0–250 | 0–15 | ||
| sedge | CAREX | Carex | 0–200 | 0–10 | ||
| tufted hairgrass | DECE | Deschampsia cespitosa | 0–200 | 0–8 | ||
| reedgrass | CALAM | Calamagrostis | 0–200 | 0–8 | ||
| mountain rush | JUARL | Juncus arcticus ssp. littoralis | 0–150 | 0–8 | ||
| foxtail barley | HOJU | Hordeum jubatum | 0–150 | 0–7 | ||
| alpine timothy | PHAL2 | Phleum alpinum | 0–100 | 0–5 | ||
| American mannagrass | GLGR | Glyceria grandis | 0–100 | 0–5 | ||
|
Forb
|
||||||
| 3 | – | |||||
| Canada thistle | CIAR4 | Cirsium arvense | 0–250 | 0–12 | ||
| snowberry | SYMPH | Symphoricarpos | 0–200 | 0–8 | ||
| cinquefoil | POTEN | Potentilla | 0–200 | 0–8 | ||
| field horsetail | EQAR | Equisetum arvense | 0–200 | 0–7 | ||
| Rocky Mountain iris | IRMI | Iris missouriensis | 0–150 | 0–5 | ||
| bedstraw | GALIU | Galium | 0–150 | 0–5 | ||
| curly dock | RUCR | Rumex crispus | 0–100 | 0–7 | ||
Table 22. Community 3.1 plant community composition
| Group | Common name | Symbol | Scientific name | Annual production (lb/acre) | Foliar cover (%) | |
|---|---|---|---|---|---|---|
|
Shrub/Vine
|
||||||
| 0–350 | ||||||
|
Grass/Grasslike
|
||||||
| 2 | 2500–5500 | |||||
| meadow foxtail | ALPR3 | Alopecurus pratensis | 1500–5000 | 50–95 | ||
| hardstem bulrush | SCAC3 | Schoenoplectus acutus | 0–500 | 0–15 | ||
| common spikerush | ELPA3 | Eleocharis palustris | 0–500 | 0–15 | ||
| sedge | CAREX | Carex | 0–500 | 2–15 | ||
| tufted hairgrass | DECE | Deschampsia cespitosa | 0–200 | 0–8 | ||
| reedgrass | CALAM | Calamagrostis | 0–200 | 0–8 | ||
| mountain rush | JUARL | Juncus arcticus ssp. littoralis | 0–150 | 0–8 | ||
| foxtail barley | HOJU | Hordeum jubatum | 0–150 | 0–7 | ||
| alpine timothy | PHAL2 | Phleum alpinum | 0–150 | 0–5 | ||
| reed canarygrass | PHAR3 | Phalaris arundinacea | 0–100 | 0–5 | ||
| American mannagrass | GLGR | Glyceria grandis | 0–100 | 0–5 | ||
| marsh arrowgrass | TRPA28 | Triglochin palustris | 0–100 | 0–5 | ||
|
Forb
|
||||||
| 3 | 150–550 | |||||
| field horsetail | EQAR | Equisetum arvense | 0–200 | 0–7 | ||
| alpine leafybract aster | SYFO2 | Symphyotrichum foliaceum | 0–150 | 0–7 | ||
| western mountain aster | SYSP | Symphyotrichum spathulatum | 0–150 | 0–7 | ||
| bedstraw | GALIU | Galium | 0–150 | 0–5 | ||
| cinquefoil | POTEN | Potentilla | 0–150 | 0–5 | ||
| Rocky Mountain iris | IRMI | Iris missouriensis | 0–150 | 0–5 | ||
Interpretations
Animal community
The following table lists production ranges for each community within each state for the Wetland ecological site. These values were obtained through on-site production data collection (clipping) as well as site estimations. The ranges were intended to cover the possible variability between sites highly dependent on additional water. Often, the current plant composition does not entirely match any particular plant community (as described in this ecological site description). A field visit is required to document actual plant composition and production. For agricultural grazing interpretations, more precise carrying capacity estimates that consider forage preference and accessibility (slope, distance to water, etc.), should be calculated using field data, particularly when grazers other than cattle are involved.
Plant Community Production (lbs./acre) :
1.1 Rush Community 2,500-3,500-4,500
1.2 Sedge Community 2,000-3,000-4,500
2.1 Invasive Grass Community 1,500-3,500-5,200
3.1 Monoculture Grass Community 3,000-5,000-6,000
Wildlife Habitat Uses:
Many of the Wetland ecological site locations in this LRU are found near the Bear River in the Bear River Valley, which includes the Cokeville Meadows National Wildlife Refuge. The Wetlands in the Cokeville Meadow Wildlife Refuge and adjacent valley provide excellent habitat for a variety of migratory birds and other wildlife species. The Refuge and surrounding areas support one of the highest densities of nesting waterfowl in Wyoming, species including white-faced ibis, black tern, and numerous other marsh and shorebirds; provides excellent potential for reintroduction of trumpeter swans; and provides habitat for local resident wildlife such as sage grouse, mule deer, elk, and pronghorn (FWS, 2024.
Hydrological functions
The Wetland Ecological Site is highly reliant on properly functioning hydrologic systems for the reference state to exist. Natural or anthropogenic disturbances that interrupt hydrologic cycles can cause transitions between states and communities. These changes are indicated by changes in vegetation composition, canopy cover, and production values. Restoring historic hydrologic regimes to a site can also cause transitions between states and communities.
Recreational uses
This site provides ample recreation and hunting opportunities for upland game species. The wide variety of plants which bloom in the spring have an aesthetic value that appeals to recreationists.
Supporting information
Inventory data references
Information presented was derived from field visits to the Bear River Valley LRU that included low to medium intensity vegetation data collection and soil concept verification. In addition, personal contacts with range-trained personnel (i.e., professional opinion of agency specialists, observations of land managers, and outside scientists), literature, and field observations were utilized in the development of this site description.
Type locality
| Location 1: Lincoln County, WY |
|---|
Other references
. 2021 (Date accessed). USDA PLANTS Database. http://plants.usda.gov.
. 2021 (Date accessed). USNVC [United States National Vegetation Classification]. 2019. United States National Vegetation Classification Database, V2.03. Federal Geographic Data Committee, Vegetation Subcommittee, Washington DC.. USNVC: http://usnvc.org/.
Fish and Wildlife Service (FWS). Cokeville Meadow National Wildlife Refuge. Retrieved from: https://www.fws.gov/refuge/cokeville-meadows on 1/17/2024.
. 2003. National Range and Pasture Handbook (NRPH). United States Department of Agriculture, Natural Resources Conservation Service, Washington, D.C..
Schoeneberger, P.J. and D.A. Wysocki. 2017. Geomorphic Description System, Version 5.0..
Additional Information:
Site concept, plant community data, and interpretations are based on ecological site descriptions (ESDs) from MLRA 34A-Foothills and Basins West (10-14W).
This ESD replaces R034AY278WY Wetland MLRA 34A-Foothills and Basins West (10-14W), but only within geographic extent of the Bear River Valley LRU.
Further data collection and ecological site refinement are ongoing until the ESD has reached "Approved" status.
Approval
Kirt Walstad, 5/06/2025
Rangeland health reference sheet
Interpreting Indicators of Rangeland Health is a qualitative assessment protocol used to determine ecosystem condition based on benchmark characteristics described in the Reference Sheet. A suite of 17 (or more) indicators are typically considered in an assessment. The ecological site(s) representative of an assessment location must be known prior to applying the protocol and must be verified based on soils and climate. Current plant community cannot be used to identify the ecological site.
| Author(s)/participant(s) | |
|---|---|
| Contact for lead author | |
| Date | 05/06/2025 |
| Approved by | Kirt Walstad |
| Approval date | |
| Composition (Indicators 10 and 12) based on | Annual Production |
Indicators
-
Number and extent of rills:
-
Presence of water flow patterns:
-
Number and height of erosional pedestals or terracettes:
-
Bare ground from Ecological Site Description or other studies (rock, litter, lichen, moss, plant canopy are not bare ground):
-
Number of gullies and erosion associated with gullies:
-
Extent of wind scoured, blowouts and/or depositional areas:
-
Amount of litter movement (describe size and distance expected to travel):
-
Soil surface (top few mm) resistance to erosion (stability values are averages - most sites will show a range of values):
-
Soil surface structure and SOM content (include type of structure and A-horizon color and thickness):
-
Effect of community phase composition (relative proportion of different functional groups) and spatial distribution on infiltration and runoff:
-
Presence and thickness of compaction layer (usually none; describe soil profile features which may be mistaken for compaction on this site):
-
Functional/Structural Groups (list in order of descending dominance by above-ground annual-production or live foliar cover using symbols: >>, >, = to indicate much greater than, greater than, and equal to):
Dominant:
Sub-dominant:
Other:
Additional:
-
Amount of plant mortality and decadence (include which functional groups are expected to show mortality or decadence):
-
Average percent litter cover (%) and depth ( in):
-
Expected annual annual-production (this is TOTAL above-ground annual-production, not just forage annual-production):
-
Potential invasive (including noxious) species (native and non-native). List species which BOTH characterize degraded states and have the potential to become a dominant or co-dominant species on the ecological site if their future establishment and growth is not actively controlled by management interventions. Species that become dominant for only one to several years (e.g., short-term response to drought or wildfire) are not invasive plants. Note that unlike other indicators, we are describing what is NOT expected in the reference state for the ecological site:
-
Perennial plant reproductive capability:
Print Options
Sections
Font
Other
The Ecosystem Dynamics Interpretive Tool is an information system framework developed by the USDA-ARS Jornada Experimental Range, USDA Natural Resources Conservation Service, and New Mexico State University.
Click on box and path labels to scroll to the respective text.