Natural Resources
Conservation Service
Ecological site BX013X01B142
Saline Subirrigated Bear River Valley 10-14" P.Z.
Last updated: 5/06/2025
Accessed: 05/19/2025
General information
Provisional. A provisional ecological site description has undergone quality control and quality assurance review. It contains a working state and transition model and enough information to identify the ecological site.
MLRA notes
Major Land Resource Area (MLRA): 013X–Eastern Idaho Plateaus
Major Land Resource Area (MLRA): 013X–Eastern Idaho Plateaus
Major Land Resource Area (MLRA) 13, Eastern Idaho Plateaus, consists of approximately five million acres in Idaho with a small part in Utah and Wyoming. It consists of six Land Resource Units (LRU). These units are divisions of the MLRA based on geology, landscape, common soils, water resources and plant community potentials. The elevation ranges from approximately 4,500 to 6,600 feet (1,370 to 2,010 m) on the plateaus and foothills to as much as 9,500 feet (2,895 m) on the mountains. Annual precipitation ranges from 10 to 48 inches (254 to 1,220 mm), with the driest areas in the Bear River Valley on the far eastern portion and the wettest areas on the mountain summits. The Fort Hall Indian Reservation and several national forests are in this MLRA, including the Caribou, Cache, and Targhee National Forests. Yellowstone and Grand Teton National Parks occur just outside the northeast boundary.
LRU notes
The Bear River Valley LRU is located on the far eastern side of MLRA 13 between the Bear River Divide and the Monte Cristo Range, from Woodruff, Utah at the southern end to Cokeville, Wyoming at the northern end. The total area of the LRU is approximately 340,000 acres. It shares a boundary with MLRA 47 - Wasatch and Uinta Mountains, 43B - Central Rocky Mountains and 46 - Northern Rocky Mountain Foothills (proposed in Wyoming).
This LRU differs from the others in its geology, which is composed mostly of alluvium and colluvium from the Stump Formation. Its weather patterns are such that the soil moisture regime is xeric, meaning there is a slight peak in winter precipitation in this LRU, with typical yearly precipitation between 10 and 15 inches (254 to 380 mm). The soil temperature regime of this LRU is frigid with mean annual soil temperatures ranging from 44 to 48 degrees Fahrenheit (6.7 to 8.8 C). The elevation range is from 5,700 to 7,000 feet (1,730 to 2,130 m).
The soils in the Bear River Valley are dominated by young aged very deep soils developed from sandstone and shale parent material re-worked with recent alluvium. Soils are dominated by Alfisols with young argillic horizons and by Fluvents in more recent alluvium.
The Bear River runs through this LRU, allowing for ample amounts of irrigation water used in the lowland areas to produce hay with smaller tributaries originating from the neighboring mountains.
Classification relationships
Relationship to Other Established Classification Systems
National Vegetation Classification System (NVC):
3 Desert & Semi-Desert Woodland, Scrub & Grassland Subclass
3.B.1 Cool Semi-Desert Scrub and Grassland Formation
M095 Great Basin-Intermountain Xeric-Riparian Scrub Macrogroup
Ecoregions (EPA):
Level I: 10 North American Deserts
Level II: 10.1 Cold Deserts
Level III: 10.1.4 Wyoming Basin
Ecological site concept
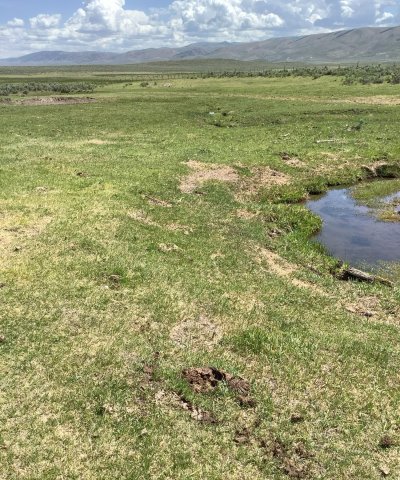
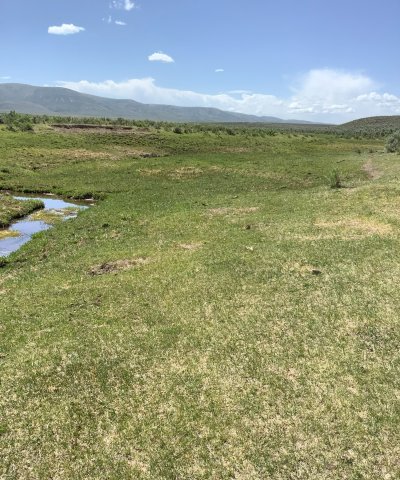
The Saline Subirrigated ecological site in the Bear River Valley is a site that receives additional moisture in addition to annual precipitation. The site is found on stream terraces, alluvial fans, and drainageways along the bear river and other adjacent riverine systems. This site is moderately to strongly saline within 20 inches (50-100cm) of the surface during most of the growing season.
This site:
o Is in a lowland position and receives significant additional moisture from runoff, streams, or a high water table
o Has a water table within rooting depth of herbaceous species - 20 to 40 inches (50 to 100cm).
o Is strongly saline (greater than 8mmhos/cm) in the top 20 inches (50 to 100cm).
Associated sites
| BX013X01G178 |
Wetland Bear River Valley The Bear River Valley Wetland site may occur adjacent to this site where the water table is closer to the surface. |
|---|---|
| BX013X01B174 |
Subirrigated Bear River Valley The Bear River Valley Subirrigated site can occur adjacent where the soil salinity drops below 8 mmhos/cm. |
| BX013X01B030 |
Overflow Bear River Valley 10-14" P.Z. The Bear River Valley Overflow site can occur adjacent where the seasonal water table is deeper in the soil profile and the salinity is less than 8 mmhos/cm at rooting depth. |
Similar sites
| BX013X01G178 |
Wetland Bear River Valley This site also has a seasonal water table but is closer to the surface for longer periods of time. |
|---|---|
| BX013X01B174 |
Subirrigated Bear River Valley This site has a seasonal water table at the same depth, but is not moderately to strongly saline. |
| BX013X01B030 |
Overflow Bear River Valley 10-14" P.Z. This site has evidence of a seasonal water table but it much deeper in the soil profile and is not moderately to strongly saline. |
| BX013X01B144 |
Saline Upland Bear River Valley 10-14" P.Z. This site is moderately to strongly saline but does not have a seasonal water table. |
Table 1. Dominant plant species
| Tree |
Not specified |
|---|---|
| Shrub |
Not specified |
| Herbaceous |
(1) Sporobolus airoides |
Legacy ID
R013XA142WY
Physiographic features
This site occurs on floodplain landforms at elevations between 6,000 and 6,600 feet. This site occurs on all slope aspects. The slopes range from nearly level to two percent. Flooding and ponding may occur on this site.
Table 2. Representative physiographic features
| Landforms |
(1)
Mountain valleys or canyons
> Stream terrace
(2) Mountain valleys or canyons > Alluvial fan (3) Mountain valleys or canyons > Drainageway |
|---|---|
| Flooding duration | Extremely brief (0.1 to 4 hours) to long (7 to 30 days) |
| Flooding frequency | Rare to frequent |
| Ponding duration | Very brief (4 to 48 hours) to long (7 to 30 days) |
| Ponding frequency | None to frequent |
| Elevation | 6,000 – 6,600 ft |
| Slope | 4% |
| Ponding depth | 3 in |
| Water table depth | 20 – 40 in |
| Aspect | W, NW, N, NE, E, SE, S, SW |
Climatic features
Annual precipitation in the Bear River Valley ranges from 10 to 14 inches per year. Wide fluctuations may occur in yearly precipitation and result in more below-average years than those with above average precipitation. Temperatures show a wide range between summer and winter and between daily maximums and minimums. This is predominantly due to the high elevation and dry air, which permits rapid incoming and outgoing radiation. Cold air outbreaks in winter move rapidly from northwest to southeast and account for extreme minimum temperatures. Roughly 25 to 30 percent of the precipitation occurs during the critical growth period, but the majority of precipitation accumulates outside the growing season, creating xeric-like conditions. The wettest rainfall month is May. The dominant plants (sagebrush and cool-season grasses) are well adapted to these conditions. Daytime winds are generally stronger than nighttime and occasional strong storms may bring brief periods of high winds with gusts to more than 50 mph. The growing season is short (60 to 90 days) and cool (critical growth period). Primary growth typically occurs between May and June. Growth of native cool-season plants begins about mid-April and continues to approximately early July. Some green-up of cool-season plants usually occurs in September with adequate fall moisture.
Table 3. Representative climatic features
| Frost-free period (characteristic range) | 10-57 days |
|---|---|
| Freeze-free period (characteristic range) | 44-105 days |
| Precipitation total (characteristic range) | 10-13 in |
| Frost-free period (actual range) | 4-75 days |
| Freeze-free period (actual range) | 30-122 days |
| Precipitation total (actual range) | 10-13 in |
| Frost-free period (average) | 35 days |
| Freeze-free period (average) | 75 days |
| Precipitation total (average) | 11 in |
Figure 1. Monthly precipitation range
Figure 2. Monthly minimum temperature range
Figure 3. Monthly maximum temperature range
Figure 4. Monthly average minimum and maximum temperature
Figure 5. Annual precipitation pattern
Figure 6. Annual average temperature pattern
Climate stations used
-
(1) LIFTON PUMPING STN [USC00105275], Montpelier, ID
-
(2) SAGE 4 NNW [USC00487955], Cokeville, WY
-
(3) RANDOLPH [USC00427165], Randolph, UT
Influencing water features
This ecological site receives additional moisture in the form of runoff from surrounding uplands, seasonal flooding (both natural and anthropogenic), and groundwater tables from the riverine system. The water table does not fluctuate outside of 20 to 40 inches during the growing season.
Wetland description
This site is not associated with wetlands.
Soil features
Soils on this site consist of very deep, poorly drained soils that formed through alluvial processes from mixed parent materials. The soils primarily exist on stream terraces but can also be found on drainageways and alluvial fans. The soils have a frigid temperature regime and an aquic moisture regime. Soils are moderately to strongly saline in the top 20 inches (50cm).
Erosion hazard is slight to moderate, and slight hummock formation is possible through grazing. These soils are susceptible to gully formation which intercepts normal overflow patterns and results in site degradation. The water table is at or near rooting depth for most of the growing season. Flooding is rare to frequent during snowmelt and just after snowmelt. Ponding can occur in small depression areas during this time period. The plant community is dependent on nearly saturated or saturated soils during a major portion of the growing season. The water table is influenced by seasonal flooding, stream flows, seeps or springs, or from run-on from adjacent sites. Soil characteristics, flooding, and water table can vary within a landscape delineation.
Table 4. Representative soil features
| Parent material |
(1)
Alluvium
|
|---|---|
| Surface texture |
(1) Loam (2) Silty clay loam |
| Drainage class | Poorly drained to very poorly drained |
| Permeability class | Moderately slow to moderately rapid |
| Soil depth | 20 – 60 in |
| Surface fragment cover <=3" | 5% |
| Surface fragment cover >3" | 2% |
| Available water capacity (0-20in) |
2.4 – 3.5 in |
| Soil reaction (1:1 water) (0-20in) |
7.7 – 8.8 |
| Subsurface fragment volume <=3" (0-15in) |
Not specified |
| Subsurface fragment volume >3" (0-5in) |
Not specified |
Table 5. Representative soil features (actual values)
| Drainage class | Not specified |
|---|---|
| Permeability class | Not specified |
| Soil depth | Not specified |
| Surface fragment cover <=3" | Not specified |
| Surface fragment cover >3" | Not specified |
| Available water capacity (0-20in) |
1.97 – 3.85 in |
| Soil reaction (1:1 water) (0-20in) |
7.4 – 8.9 |
| Subsurface fragment volume <=3" (0-15in) |
Not specified |
| Subsurface fragment volume >3" (0-5in) |
Not specified |
Ecological dynamics
A state-and-transition model (STM) diagram is depicted in this section. Thorough descriptions of each state, transition, plant community phase, and pathway are found after the model in this document. This diagram is based on available experimental research, field observations, professional consensus, and interpretations. While based on the best available information, the STM will change over time as knowledge of ecological processes increases.
Plant community composition within the same ecological site has a natural range of variability across the LRU due to naturally occurring variability in weather, soils, and aspect. Not all managers will choose the Reference Plant community as the management goal. Other plant communities may be desired to meet land management objectives. This is valid as long as the rangeland health attributes assessment departures are none to slight or slight to moderate from the Reference state. The biological processes on this site are complex; therefore, representative values are presented in a land management context. The species lists are representative and are not botanical descriptions of all species occurring, or potentially occurring, on this site. They are not intended to cover every situation or the full range of conditions, species, and responses to the site.
Both percent species composition by weight and percent cover are used in this ESD. Most observers find it easier to visualize or estimate percent cover for woody species (trees and shrubs). Foliar cover is used to define plant community phases and states in the state-and-transition model. Cover drives the transitions between communities and states because of the influence of shade and interception of rainfall.
Species composition by dry weight remains an important descriptor of the herbaceous community and of site productivity as a whole and includes both herbaceous and woody species. Calculating similarity index requires data on species composition by dry weight.
Although there is considerable qualitative experience supporting the pathways and transitions within the state-and-transition model, no quantitative information exists that specifically identifies threshold parameters between the Reference state and Degraded state in this ecological site.
State and transition model
More interactive model formats are also available.
View Interactive Models
Click on state and transition labels to scroll to the respective text
Ecosystem states
State 1 submodel, plant communities
State 2 submodel, plant communities
State 3 submodel, plant communities
State 1
Reference
The Reference state of this ecological site is dominated by a mix of native grasses and forbs, many species being salt-tolerant. The plant communities in the Reference state evolved with grazing by large herbivores and are suited for managed grazing by domestic livestock. The primary salt-tolerant grass species found at this site in the Reference state include alkali sacaton (Sporobolus airoides), Nutall alkaligrass (Puccinellia nuttalliana), and saltgrass (Distichlis spicata). Other major grass, sedge, and rush species include needlelfeaf sedge (Carex duriuscula), western wheatgrass (Pascopyrum smithii) and slender wheatgrass (Elymus trachycaulus), Sandberg bluegrass (Poa secunda), arctic rush (Juncus arcticus), and basin wildrye (Leymus cinereus). Shrub composition and cover is generally limited at this site but can include greasewood (Sarcobatus vermiculatus) and rubber rabbitbrush (Ericameria nauseous). Forb cover can include goldenweed (Pyrrocoma sp.), arrowgrass (Triglochin sp.), and other perennial and annual forbs. Each plant community within the reference state differs in percent composition and canopy cover. Three important processes occur in the Reference state and result in community changes: 1) Changes to the hydrologic regime; 2) Disturbances such as herbivory and drought; and 3) Specific salinity concentration within plant rooting depth.
Characteristics and indicators. Community occurrence as well as shifts between communities are a result of localized variation in the hydrology, small-scale disturbance, or localized soil salinity levels. Sites with the water table closer to the surface or inundated for longer periods of time are more likely to result in the Sedge/Grass community. Sites that have higher salinity concentrations are more likely to result in the Alkali Sacaton/Basin Wildrye community.
Resilience management. Resilience in the Reference state of this ecological site is strongly tied to hydrologic function. When the hydrologic system is functioning properly, resilience is high. If changes in the hydrologic regime occur due to natural or anthropogenic disturbances. Resilience decreases.
Dominant plant species
-
greasewood (Sarcobatus vermiculatus), shrub
-
rubber rabbitbrush (Ericameria nauseosa), shrub
-
alkali sacaton (Sporobolus airoides), grass
-
needleleaf sedge (Carex duriuscula), grass
-
mountain rush (Juncus arcticus ssp. littoralis), grass
-
goldenweed (Pyrrocoma), other herbaceous
-
horsetail (Equisetum), other herbaceous
Community 1.1
Sedge and Rush
The Sedge and Rush community occurs where the seasonal water table is closer to the surface, near the 20 inch concept of the ecological site. The additional water allows for species better adapted to wetter conditions and less salt-tolerant. The dominant grasslike species in this community include needleleaf sedge (Carex duriuscula) and arctic rush (Juncus arcticus). A variety of forbs including goldenweed (Pyrrocoma sp.), horsetail (Equisetum sp.), and aster species (Symphyotrichum sp.). Although shrubs are uncommon at this ecological site, greasewood (Sarcobatus vermiculatus) and rubber rabbitbrush (Ericameria nauseosa) can occasionally occupy small portions of the canopy. Production values range from 950 to 2,300 pounds per acre, averaging 1,500 pounds per acre. This community evolved with grazing by large herbivores and is suited for managed grazing by domestic livestock.
Resilience management. This community is moderately to highly resilient because of its reliable water supply and moderate biodiversity. Disturbances that alter the hydrologic regime or native plant cover can cause a transition to the Disturbed state.
Dominant plant species
-
greasewood (Sarcobatus vermiculatus), shrub
-
rubber rabbitbrush (Ericameria nauseosa), shrub
-
needleleaf sedge (Carex duriuscula), grass
-
mountain rush (Juncus arcticus ssp. littoralis), grass
-
goldenweed (Pyrrocoma), other herbaceous
-
aster (Symphyotrichum), other herbaceous
Figure 7. Annual production by plant type (representative values) or group (midpoint values)
Table 6. Annual production by plant type
| Plant type | Low (lb/acre) |
Representative value (lb/acre) |
High (lb/acre) |
|---|---|---|---|
| Grass/Grasslike | 800 | 1300 | 2000 |
| Forb | 75 | 150 | 250 |
| Shrub/Vine | 0 | 0 | 250 |
| Total | 875 | 1450 | 2500 |
Table 7. Ground cover
| Tree foliar cover | 0% |
|---|---|
| Shrub/vine/liana foliar cover | 0-10% |
| Grass/grasslike foliar cover | 25-80% |
| Forb foliar cover | 3-10% |
| Non-vascular plants | 0% |
| Biological crusts | 0% |
| Litter | 3-8% |
| Surface fragments >0.25" and <=3" | 0% |
| Surface fragments >3" | 0% |
| Bedrock | 0% |
| Water | 0% |
| Bare ground | 0-8% |
Table 8. Soil surface cover
| Tree basal cover | 0% |
|---|---|
| Shrub/vine/liana basal cover | 0-10% |
| Grass/grasslike basal cover | 30-85% |
| Forb basal cover | 4-12% |
| Non-vascular plants | 0% |
| Biological crusts | 0% |
| Litter | 50-95% |
| Surface fragments >0.25" and <=3" | 0% |
| Surface fragments >3" | 0% |
| Bedrock | 0% |
| Water | 0% |
| Bare ground | 0-10% |
Figure 8. Plant community growth curve (percent production by month). ID0115, B9 DRY MEADOW. State 1.
| Jan | Feb | Mar | Apr | May | Jun | Jul | Aug | Sep | Oct | Nov | Dec |
|---|---|---|---|---|---|---|---|---|---|---|---|
| J | F | M | A | M | J | J | A | S | O | N | D |
| 0 | 0 | 0 | 10 | 20 | 25 | 25 | 10 | 10 | 0 | 0 | 0 |
Community 1.2
Alkali Sacaton and Basin Wildrye
This community is dominated by salt-tolerant plant species. This community occurs when saline concentrations are high and the seasonal water table is slightly deeper in the soil profile. The primary overstory species are alkali sacaton (Sporobolus airoides) and basin wildrye (Leymus cinereus), western wheatgrass, slender wheatgrass, Sandberg bluegrass, scratchgrass (Muhlenbergia asperifolia), and Nutall's alkaligrass (Puccinellia nuttalliana). Perennial forbs such as horsetail, aster, and various vetch species make up less than 10 percent of the overall canopy cover. Greasewood and rubber rabbitbrush can occur on sites but are less common, and do not occupy over 15 percent canopy cover. This community has evolved with historic grazing by large herbivores and is suited for managed grazing. Production can range from 2,000 to 3,500 pounds per acre, averaging 3,000 pounds per acre. This is a critical community able to be highly productive under saline soil conditions.
Resilience management. This community is moderately to highly resilient because of its reliable water supply and moderate biodiversity. Disturbances that alter the hydrologic regime or native plant cover can cause a transition to the Disturbed state.
Dominant plant species
-
greasewood (Sarcobatus vermiculatus), shrub
-
rubber rabbitbrush (Ericameria nauseosa), shrub
-
basin wildrye (Leymus cinereus), grass
-
alkali sacaton (Sporobolus airoides), grass
-
horsetail (Equisetum), other herbaceous
-
aster (Symphyotrichum), other herbaceous
Figure 9. Annual production by plant type (representative values) or group (midpoint values)
Table 9. Annual production by plant type
| Plant type | Low (lb/acre) |
Representative value (lb/acre) |
High (lb/acre) |
|---|---|---|---|
| Grass/Grasslike | 1000 | 2200 | 2800 |
| Forb | 50 | 200 | 300 |
| Shrub/Vine | 0 | 100 | 250 |
| Total | 1050 | 2500 | 3350 |
Table 10. Ground cover
| Tree foliar cover | 0% |
|---|---|
| Shrub/vine/liana foliar cover | 0-10% |
| Grass/grasslike foliar cover | 25-80% |
| Forb foliar cover | 3-10% |
| Non-vascular plants | 0% |
| Biological crusts | 0% |
| Litter | 3-8% |
| Surface fragments >0.25" and <=3" | 0% |
| Surface fragments >3" | 0% |
| Bedrock | 0% |
| Water | 0% |
| Bare ground | 0-8% |
Table 11. Soil surface cover
| Tree basal cover | 0% |
|---|---|
| Shrub/vine/liana basal cover | 0-10% |
| Grass/grasslike basal cover | 30-85% |
| Forb basal cover | 4-12% |
| Non-vascular plants | 0% |
| Biological crusts | 0% |
| Litter | 50-95% |
| Surface fragments >0.25" and <=3" | 0% |
| Surface fragments >3" | 0% |
| Bedrock | 0% |
| Water | 0% |
| Bare ground | 0-10% |
Figure 10. Plant community growth curve (percent production by month). ID0115, B9 DRY MEADOW. State 1.
| Jan | Feb | Mar | Apr | May | Jun | Jul | Aug | Sep | Oct | Nov | Dec |
|---|---|---|---|---|---|---|---|---|---|---|---|
| J | F | M | A | M | J | J | A | S | O | N | D |
| 0 | 0 | 0 | 10 | 20 | 25 | 25 | 10 | 10 | 0 | 0 | 0 |
Pathway 1.1A
Community 1.1 to 1.2
The transition from Community 1.1 to Community 1.2 is a result of localized abiotic conditions involving the depth to seasonal water table and saline concentrations in the rooting depth of the plants. Community 1.2 consists of plants more tolerant of saline conditions and less available moisture.
Context dependence. Saline concentrations in the rooting depth of the soil can change rapidly and result in a mosaic between communities 1.1 and 1.2. Water table depths fluctuate throughout the season, however average seasonal depth varies across the landscape.
State 2
Grazing Resistant
The Grazing Resistant state is a result of continuous grazing by domestic livestock at high intensity. The grazing-related disturbances lead to a decrease in diversity, promoting species that are able to tolerate heavy grazing. Dominant salt-tolerant species include scratchgrass (Muhlenbergia asperifolia) and Sandberg bluegrass. Other dominant plants include arctic rush, and western wheatgrass. Hydrology is functioning in this state, but the biotic integrity is at risk due to a lack of species diversity. Lack of diversity as well as grazing pressure can also lead to an increase in invasive species establishment.
Characteristics and indicators. This site is indicated by a lack of overall diversity in the plant composition as well as an increased overstory in grazing-tolerant plants. Continued heavy grazing makes these characteristics more pronounced and can eventually result in transition to the disturbed community if not managed.
Resilience management. This state is moderately resilient. Resilience is gained by the shallow depth of a seasonal water table, which can moderate the impact of drought conditions. However, the lack of diversity makes this site more susceptible to the impacts of disturbances such as insect damage, disease, herbivory, and fire.
Dominant plant species
-
greasewood (Sarcobatus vermiculatus), shrub
-
rubber rabbitbrush (Ericameria nauseosa), shrub
-
Sandberg bluegrass (Poa secunda), grass
-
scratchgrass (Muhlenbergia asperifolia), grass
Community 2.1
Short Stature Grass
The Short Stature Grass community is a result of continuous, high-intensity grazing. Much of the diversity of the Reference state is lost. The composition and canopy cover of grazing-tolerant, often rhizomatous species increases. The loss of diversity also creates opportunities for invasive species establishment. The primary grass species present are Sandberg bluegrass, slender wheatgrass, and western wheatgrass, and less palatable salt-tolerant species like alkali sacaton. Total production is less for this community than for communities in the Reference state. Production ranges from 600 to 2,000 pounds per acre, averaging 1,250 pounds per acre. If overgrazing continues for extended periods of time and invasive species occupy more of the composition and canopy, this state can transition to the Disturbed state.
Resilience management. This site has moderate resilience as a result of the additional water availability from seasonal water table levels. Resilience is lost on this site due to lack of diversity and the potential establishment of non-native species.
Dominant plant species
-
greasewood (Sarcobatus vermiculatus), shrub
-
rubber rabbitbrush (Ericameria nauseosa), shrub
-
Sandberg bluegrass (Poa secunda), grass
-
alkali sacaton (Sporobolus airoides), grass
-
aster (Symphyotrichum), other herbaceous
-
horsetail (Equisetum), other herbaceous
Figure 11. Annual production by plant type (representative values) or group (midpoint values)
Table 12. Annual production by plant type
| Plant type | Low (lb/acre) |
Representative value (lb/acre) |
High (lb/acre) |
|---|---|---|---|
| Grass/Grasslike | 550 | 1000 | 1700 |
| Shrub/Vine | 0 | 200 | 400 |
| Forb | 75 | 150 | 225 |
| Total | 625 | 1350 | 2325 |
Table 13. Ground cover
| Tree foliar cover | 0% |
|---|---|
| Shrub/vine/liana foliar cover | 0-15% |
| Grass/grasslike foliar cover | 15-55% |
| Forb foliar cover | 3-12% |
| Non-vascular plants | 0% |
| Biological crusts | 0% |
| Litter | 1-6% |
| Surface fragments >0.25" and <=3" | 0% |
| Surface fragments >3" | 0% |
| Bedrock | 0% |
| Water | 0% |
| Bare ground | 2-12% |
Table 14. Soil surface cover
| Tree basal cover | 0% |
|---|---|
| Shrub/vine/liana basal cover | 0-10% |
| Grass/grasslike basal cover | 20-65% |
| Forb basal cover | 5-15% |
| Non-vascular plants | 0% |
| Biological crusts | 0% |
| Litter | 20-70% |
| Surface fragments >0.25" and <=3" | 0% |
| Surface fragments >3" | 0% |
| Bedrock | 0% |
| Water | 0% |
| Bare ground | 5-15% |
Figure 12. Plant community growth curve (percent production by month). ID0115, B9 DRY MEADOW. State 1.
| Jan | Feb | Mar | Apr | May | Jun | Jul | Aug | Sep | Oct | Nov | Dec |
|---|---|---|---|---|---|---|---|---|---|---|---|
| J | F | M | A | M | J | J | A | S | O | N | D |
| 0 | 0 | 0 | 10 | 20 | 25 | 25 | 10 | 10 | 0 | 0 | 0 |
State 3
Disturbed
The Disturbed state is a result of natural or anthropogenic disturbances to the ecological site. The two primary disturbances that impact this site are plowing and haying practices, followed by abandonment and activities that alter the natural hydrologic regime. These disturbances lead to the introduction and establishment of non-native species. Following the disturbance, the common grass species that establish are meadow foxtail (Alopecurus spp.), foxtail barley (Hordeum jubatum), and quackgrass (Elymus repens). Common forbs include Canada thistle (Cirsium arvense) and povertyweed (Iva axillaris).
Characteristics and indicators. This state is dependent on disturbances that displace native vegetation and create opportunities for invasive species establishment. The severity and frequency of the disturbance can often dictate the level of establishment of invasive species. Alteration of hydrology that cannot be restored has the potential to shift create a shift to a new ecological site.
Resilience management. This site has low resilience and biotic integrity due to the composition of non-native plant species. Mechanical treatments followed by reseeding and prescribed grazing will aid in the transition back to the Reference state. For restoration to be successful, the historic hydrologic regime must be functional with reliable seasonal water table levels. Regardless of intervention and restoration techniques, some invasive species such as foxtail barely and meadow foxtail may continue to persist to some degree.
Community 3.1
Foxtail Barley and Quackgrass
This community occurs after an ecological site has been plowed or cropped and then improperly managed or abandoned. The two primary grasses that begin to dominate the site after this occurs are foxtail barely (Hordeum jubatum) and quackgrass (Elymus repens). Foxtail barley is well adapted to saline conditions as well as disturbed sites and is able to rapidly establish after abandonment. Quackgrass is highly competitive with native vegetation and is able to quickly increase canopy cover on a site. Invasive forbs can also be present on site, including povertyweed (Iva axillaris) and field sowthistle (Sonchus arvensis). Total annual production varies with this community but tends to be lower than any community in the Reference state. Production ranges from 1,000 to 1,900 pounds per acre, averaging 1,500 pounds per acre.
Resilience management. This site has low resilience due to lack of diversity and invasive species recruitment. Once established, the dominant plants of this community outcompete and prevent return of desired and native species.
Dominant plant species
-
rubber rabbitbrush (Ericameria nauseosa), shrub
-
greasewood (Sarcobatus vermiculatus), shrub
-
foxtail barley (Hordeum jubatum), grass
-
quackgrass (Elymus repens), grass
Figure 13. Annual production by plant type (representative values) or group (midpoint values)
Table 15. Annual production by plant type
| Plant type | Low (lb/acre) |
Representative value (lb/acre) |
High (lb/acre) |
|---|---|---|---|
| Grass/Grasslike | 750 | 1100 | 1500 |
| Forb | 50 | 150 | 300 |
| Shrub/Vine | 0 | 150 | 300 |
| Total | 800 | 1400 | 2100 |
Community 3.2
Invasive Species
This community is disturbance-driven. Specific disturbances drive a transition from native vegetation to one dominated by invasive species. The severity or frequency of the respective disturbance plays a role in how quickly invasive species can establish and to what extent. Disturbances such as continuous intensive grazing, plowing followed by abandonment, or any disturbance which interrupts the hydrologic cycle are particularly impactful. This community is dominated by invasive grass and forb species including meadow foxtail, quackgrass, povertyweed, Canada thistle, and other annual forbs. Production for this community is lower than in most other states and communities. The production range is 500 to 1,400 pounds per acre, averaging 1,000 pounds per acre.
Resilience management. This community has low resilience due to the lack of native vegetation and the impact of current or past disturbances. Once invasive established, it is difficult and resource intensive to remove them completely.
Dominant plant species
-
rubber rabbitbrush (Ericameria nauseosa), shrub
-
greasewood (Sarcobatus vermiculatus), shrub
-
meadow foxtail (Alopecurus pratensis), grass
-
quackgrass (Elymus repens), grass
-
povertyweed (Iva axillaris), other herbaceous
-
Canada thistle (Cirsium arvense), other herbaceous
Figure 14. Annual production by plant type (representative values) or group (midpoint values)
Table 16. Annual production by plant type
| Plant type | Low (lb/acre) |
Representative value (lb/acre) |
High (lb/acre) |
|---|---|---|---|
| Grass/Grasslike | 200 | 550 | 800 |
| Shrub/Vine | 0 | 150 | 300 |
| Forb | 75 | 150 | 250 |
| Total | 275 | 850 | 1350 |
Pathway 3.1A
Community 3.1 to 3.2
The transition from Community 3.1 to Community 3.2 is a result of localized abiotic conditions and presence of available seed sources of invasive species. Composition of invasive species in Community 3.2 is more diverse and foxtail barely and quackgrass comprise a lower percentage of the canopy. Other invasive species are able to rapidly establish and contribute to a greater overall portion of canopy cover and production.
Context dependence. This transition can also be a result of site specific saline concentrations. Levels of salinity can dictate which plants are able to establish at a given site.
Pathway 3.2A
Community 3.2 to 3.1
Transition T1A
State 1 to 2
The transition from the Reference state to the Grazing Resistant state is driven by grazing-related disturbances. Continuous grazing or extended periods of intense grazing can reduce the presence of grazing-intolerant species, decrease diversity, and increase canopy cover of increaser species. If grazing practices continue and mitigation measures are not taken, this can eventually cause a transition to the Disturbed state.
Constraints to recovery. The primary constraint to recovery is improper grazing management. Resting periods and decreased grazing intensity will be needed for recovery and restoration towards the Reference state.
Context dependence. The transition from the Reference state to the Grazing Resistant state can be affected by seasonal weather patterns and other disturbances such as drought or fire.
Transition T1B
State 1 to 3
The transition from the Reference state to the Disturbed state is a result of both natural and anthropogenic disturbances. High-severity disturbances and those outside of the natural disturbance regime are more likely to initiate a transition from the Reference state. The primary disturbances impacting this ecological site resulting in transition include agricultural plowing and abandonment, drought, fire, and alteration of the hydrologic regime.
Constraints to recovery. Constraints to recovery vary based on disturbance history. Non-functioning hydrology can severely limit restoration. Continued disturbances, even low in severity, as well as potential invasive species establishment can also constrain recovery.
Context dependence. Restoration is affected by seasonal weather patterns, current disturbance regimes, and the severity of past disturbances. If the site has a significant canopy cover and composition of invasive species, this will also impact management decisions and the likelihood of restoration success.
Restoration pathway R2A
State 2 to 1
Restoration from the Grazing Resistant state to the Reference state requires a change in grazing practices. Less intensive grazing with periods of rest can facilitate natural return to the Reference state. Removal of invasive species and seeding may be required depending on conditions.
Context dependence. Restoration success is dependent on successful grazing plans and adaptive management. Restoration time can be decreased through seeding and rest from grazing. Other disturbances such as drought, fire, or alteration of the hydrologic function can slow restoration or initiate transition to the Disturbed state.
Transition T2A
State 2 to 3
The transition from the Grazing Resistant state to the Disturbed state is a mechanism of severe or repeated disturbance, often outside the historic disturbance regime for the ecological site. The most common disturbances to initiate the transition are continuous intensive grazing, fire, drought, and alteration of the hydrologic regime. These disturbances result in the removal of grazing-resistant species, which allows for the establishment of fast-establishing invasive species.
Constraints to recovery. Restoration to the Grazing Resistant state is dependent on severity of initial disturbance and absence of disturbances during recovery time. If the hydrologic regime has been altered, function will need to be returned before successful restoration can occur.
Context dependence. Restoration likelihood is affected by seasonal weather patterns, current disturbance regimes, and severity of past disturbances. If the site has a significant canopy cover and composition of invasive species, this will also impact management decisions and the likelihood of restoration success.
Restoration pathway R3A
State 3 to 1
Restoration from the Disturbed state to the Reference state requires removal of invasive species and restoration of the hydrologic regime to historic depth and seasonal duration if it has been altered. Removal of invasive species can be achieved through mechanical and chemical treatments, targeted grazing, or a combination of the three. Success of invasive species removal is improved if planting or seeding of native species is completed afterward.
Context dependence. Restoration success is dependent on ability to restore hydrologic function a level of invasive species establishment. Time without further disturbance also increases restoration success.
Restoration pathway R3B
State 3 to 2
Restoration from the Disturbed state to the Grazing Resistant state requires removal of invasive species and restoration of the hydrologic regime to historic depth and seasonal duration if it has been altered. Removal of invasive species can be achieved through mechanical and chemical treatments, targeted grazing, or a combination of the three. Success of invasive species removal is improved if planting or seeding of native species is completed afterward.
Context dependence. Restoration success is dependent on the ability to restore hydrologic function a level of invasive species establishment. Time without further disturbance also increases restoration success.
Additional community tables
Table 17. Community 1.1 plant community composition
| Group | Common name | Symbol | Scientific name | Annual production (lb/acre) | Foliar cover (%) | |
|---|---|---|---|---|---|---|
|
Shrub/Vine
|
||||||
| 1 | 0–250 | |||||
| rubber rabbitbrush | ERNA10 | Ericameria nauseosa | 0–150 | 0–5 | ||
| greasewood | SAVE4 | Sarcobatus vermiculatus | 0–100 | 0–3 | ||
|
Grass/Grasslike
|
||||||
| 2 | 800–2000 | |||||
| mountain rush | JUARL | Juncus arcticus ssp. littoralis | 175–750 | 8–52 | ||
| needleleaf sedge | CADU6 | Carex duriuscula | 175–700 | 8–50 | ||
| basin wildrye | LECI4 | Leymus cinereus | 0–175 | 0–8 | ||
| Sandberg bluegrass | POSE | Poa secunda | 0–150 | 0–7 | ||
| slender wheatgrass | ELTR7 | Elymus trachycaulus | 0–150 | 0–7 | ||
| squirreltail | ELEL5 | Elymus elymoides | 0–125 | 0–5 | ||
| western wheatgrass | PASM | Pascopyrum smithii | 0–125 | 0–5 | ||
| meadow foxtail | ALPR3 | Alopecurus pratensis | 0–125 | 0–5 | ||
| alkali sacaton | SPAI | Sporobolus airoides | 0–100 | 0–3 | ||
| scratchgrass | MUAS | Muhlenbergia asperifolia | 0–100 | 0–3 | ||
| saltgrass | DISP | Distichlis spicata | 0–100 | 0–3 | ||
|
Forb
|
||||||
| 3 | 75–250 | |||||
Table 18. Community 1.2 plant community composition
| Group | Common name | Symbol | Scientific name | Annual production (lb/acre) | Foliar cover (%) | |
|---|---|---|---|---|---|---|
|
Shrub/Vine
|
||||||
| 1 | 0–250 | |||||
| greasewood | SAVE4 | Sarcobatus vermiculatus | 0–200 | 0–10 | ||
| rubber rabbitbrush | ERNA10 | Ericameria nauseosa | 0–100 | 0–7 | ||
|
Grass/Grasslike
|
||||||
| 2 | 1000–2800 | |||||
| alkali sacaton | SPAI | Sporobolus airoides | 300–950 | 10–30 | ||
| basin wildrye | LECI4 | Leymus cinereus | 150–750 | 5–25 | ||
| needleleaf sedge | CADU6 | Carex duriuscula | 0–300 | 0–15 | ||
| Sandberg bluegrass | POSE | Poa secunda | 50–200 | 3–8 | ||
| scratchgrass | MUAS | Muhlenbergia asperifolia | 50–200 | 3–8 | ||
| saltgrass | DISP | Distichlis spicata | 50–200 | 3–8 | ||
| meadow foxtail | ALPR3 | Alopecurus pratensis | 0–150 | 0–5 | ||
| slender wheatgrass | ELTR7 | Elymus trachycaulus | 0–150 | 0–5 | ||
| squirreltail | ELEL5 | Elymus elymoides | 0–150 | 0–5 | ||
| western wheatgrass | PASM | Pascopyrum smithii | 0–150 | 0–5 | ||
|
Forb
|
||||||
| 3 | 50–300 | |||||
| Forb, perennial | 2FP | Forb, perennial | 75–300 | 5–12 | ||
Table 19. Community 2.1 plant community composition
| Group | Common name | Symbol | Scientific name | Annual production (lb/acre) | Foliar cover (%) | |
|---|---|---|---|---|---|---|
|
Shrub/Vine
|
||||||
| 1 | 0–400 | |||||
| greasewood | SAVE4 | Sarcobatus vermiculatus | 0–200 | 0–15 | ||
| rubber rabbitbrush | ERNA10 | Ericameria nauseosa | 0–200 | 0–15 | ||
|
Grass/Grasslike
|
||||||
| 2 | 550–1700 | |||||
| alkali sacaton | SPAI | Sporobolus airoides | 100–400 | 3–15 | ||
| Sandberg bluegrass | POSE | Poa secunda | 100–350 | 3–15 | ||
| saltgrass | DISP | Distichlis spicata | 0–200 | 0–10 | ||
| slender wheatgrass | ELTR7 | Elymus trachycaulus | 25–175 | 1–10 | ||
| western wheatgrass | PASM | Pascopyrum smithii | 25–175 | 1–10 | ||
| meadow foxtail | ALPR3 | Alopecurus pratensis | 0–150 | 0–8 | ||
|
Forb
|
||||||
| 3 | 75–225 | |||||
| Forb, perennial | 2FP | Forb, perennial | 50–200 | 3–15 | ||
Table 20. Community 3.1 plant community composition
| Group | Common name | Symbol | Scientific name | Annual production (lb/acre) | Foliar cover (%) | |
|---|---|---|---|---|---|---|
|
Shrub/Vine
|
||||||
| 1 | 0–300 | |||||
| rubber rabbitbrush | ERNA10 | Ericameria nauseosa | 0–150 | 0–7 | ||
| greasewood | SAVE4 | Sarcobatus vermiculatus | 0–150 | 0–7 | ||
|
Grass/Grasslike
|
||||||
| 2 | 750–1500 | |||||
| foxtail barley | HOJU | Hordeum jubatum | 150–500 | 5–20 | ||
| quackgrass | ELRE4 | Elymus repens | 150–500 | 5–20 | ||
| basin wildrye | LECI4 | Leymus cinereus | 0–200 | 0–10 | ||
| western wheatgrass | PASM | Pascopyrum smithii | 0–200 | 0–10 | ||
| slender wheatgrass | ELTR7 | Elymus trachycaulus | 0–200 | 0–10 | ||
| Sandberg bluegrass | POSE | Poa secunda | 0–150 | 0–5 | ||
|
Forb
|
||||||
| 3 | 50–300 | |||||
| Forb, perennial | 2FP | Forb, perennial | 50–300 | 3–12 | ||
Table 21. Community 3.2 plant community composition
| Group | Common name | Symbol | Scientific name | Annual production (lb/acre) | Foliar cover (%) | |
|---|---|---|---|---|---|---|
|
Shrub/Vine
|
||||||
| 1 | 0–300 | |||||
| greasewood | SAVE4 | Sarcobatus vermiculatus | – | – | ||
| rubber rabbitbrush | ERNA10 | Ericameria nauseosa | – | – | ||
|
Grass/Grasslike
|
||||||
| 2 | 200–800 | |||||
| meadow foxtail | ALPR3 | Alopecurus pratensis | 100–550 | 5–25 | ||
| quackgrass | ELRE4 | Elymus repens | 100–300 | 5–15 | ||
| western wheatgrass | PASM | Pascopyrum smithii | 0–150 | 0–10 | ||
| slender wheatgrass | ELTR7 | Elymus trachycaulus | 0–150 | 0–10 | ||
| Sandberg bluegrass | POSE | Poa secunda | 0–150 | 0–10 | ||
| saltgrass | DISP | Distichlis spicata | 0–150 | 0–10 | ||
|
Forb
|
||||||
| 3 | 75–250 | |||||
| Forb, annual | 2FA | Forb, annual | 0–200 | 0–15 | ||
| Canada thistle | CIAR4 | Cirsium arvense | 25–175 | 2–12 | ||
| povertyweed | IVAX | Iva axillaris | 25–150 | 2–12 | ||
Interpretations
Animal community
The following table lists production ranges for each community within each state for the Saline Subirrigated ecological site. These values were obtained through on-site production data collection (clipping) as well as site estimations. The ranges were intended to cover the possible variability between sites moderately dependent on additional water. Often, the current plant composition does not entirely match any particular plant community (as described in this ecological site description). A field visit is required to document actual plant composition and production. For agricultural grazing interpretations, more precise carrying capacity estimates that consider forage preference and accessibility (slope, distance to water, etc.), should be calculated using field data, particularly when grazers other than cattle are involved.
Plant Community Production (lbs./acre) :
1.1 Sedge/Rush Community 950-1,500-2,300
1.2 Alkali Sacton/Basin Wildrye Community 2,000-3,000-3,500
2.1 Short Stature Grass Community 600-1,250-2,000
3.1 Monoculture Grass Community 3,000-5,000-6,000
Wildlife Habitat Uses:
Many of the Saline Subirrigated ecological site locations in this LRU are found near the Bear River in the Bear River Valley, which includes the Cokeville Meadows National Wildlife Refuge. The Wetlands in the Cokeville Meadow Wildlife Refuge and adjacent valley provide excellent habitat for a variety of migratory birds and other wildlife species. The Refuge and surrounding areas support one of the highest densities of nesting waterfowl in Wyoming, species including white-faced ibis, black tern, and numerous other marsh and shorebirds; provides excellent potential for reintroduction of trumpeter swans; and provides habitat for local resident wildlife such as sage grouse, mule deer, elk, and pronghorn (FWS, 2024).
Supporting information
Inventory data references
Information presented was derived from field visits to the Bear River Valley LRU that included low to medium intensity vegetation data collection and soil concept verification. In addition, personal contacts with range-trained personnel (i.e., professional opinion of agency specialists, observations of land managers, and outside scientists), literature, and field observations were utilized in the development of this site description.
Type locality
| Location 1: Lincoln County, WY |
|---|
Other references
. 2021 (Date accessed). USDA PLANTS Database. http://plants.usda.gov.
. 2021 (Date accessed). USNVC [United States National Vegetation Classification]. 2019. United States National Vegetation Classification Database, V2.03. Federal Geographic Data Committee, Vegetation Subcommittee, Washington DC.. USNVC: http://usnvc.org/.
Fish and Wildlife Service (FWS). Cokeville Meadow National Wildlife Refuge. Retrieved from: https://www.fws.gov/refuge/cokeville-meadows on 1/17/2024.
. 2003. National Range and Pasture Handbook (NRPH). United States Department of Agriculture, Natural Resources Conservation Service, Washington, D.C..
Schoeneberger, P.J. and D.A. Wysocki. 2017. Geomorphic Description System, Version 5.0..
Additional Information:
Site concept, plant community data, and interpretations are based on ecological site descriptions (ESDs) from MLRA 34A-Foothills and Basins West (10-14W).
This ESD replaces R034AY242WY Saline Subirrigated MLRA 34A-Foothills and Basins West (10-14W), but only within geographic extent of the Bear River Valley LRU.
Further data collection and ecological site refinement are ongoing until the ESD has reached "Approved" status.
Approval
Kirt Walstad, 5/06/2025
Rangeland health reference sheet
Interpreting Indicators of Rangeland Health is a qualitative assessment protocol used to determine ecosystem condition based on benchmark characteristics described in the Reference Sheet. A suite of 17 (or more) indicators are typically considered in an assessment. The ecological site(s) representative of an assessment location must be known prior to applying the protocol and must be verified based on soils and climate. Current plant community cannot be used to identify the ecological site.
| Author(s)/participant(s) | |
|---|---|
| Contact for lead author | |
| Date | 05/06/2025 |
| Approved by | Kirt Walstad |
| Approval date | |
| Composition (Indicators 10 and 12) based on | Annual Production |
Indicators
-
Number and extent of rills:
-
Presence of water flow patterns:
-
Number and height of erosional pedestals or terracettes:
-
Bare ground from Ecological Site Description or other studies (rock, litter, lichen, moss, plant canopy are not bare ground):
-
Number of gullies and erosion associated with gullies:
-
Extent of wind scoured, blowouts and/or depositional areas:
-
Amount of litter movement (describe size and distance expected to travel):
-
Soil surface (top few mm) resistance to erosion (stability values are averages - most sites will show a range of values):
-
Soil surface structure and SOM content (include type of structure and A-horizon color and thickness):
-
Effect of community phase composition (relative proportion of different functional groups) and spatial distribution on infiltration and runoff:
-
Presence and thickness of compaction layer (usually none; describe soil profile features which may be mistaken for compaction on this site):
-
Functional/Structural Groups (list in order of descending dominance by above-ground annual-production or live foliar cover using symbols: >>, >, = to indicate much greater than, greater than, and equal to):
Dominant:
Sub-dominant:
Other:
Additional:
-
Amount of plant mortality and decadence (include which functional groups are expected to show mortality or decadence):
-
Average percent litter cover (%) and depth ( in):
-
Expected annual annual-production (this is TOTAL above-ground annual-production, not just forage annual-production):
-
Potential invasive (including noxious) species (native and non-native). List species which BOTH characterize degraded states and have the potential to become a dominant or co-dominant species on the ecological site if their future establishment and growth is not actively controlled by management interventions. Species that become dominant for only one to several years (e.g., short-term response to drought or wildfire) are not invasive plants. Note that unlike other indicators, we are describing what is NOT expected in the reference state for the ecological site:
-
Perennial plant reproductive capability:
Print Options
Sections
Font
Other
The Ecosystem Dynamics Interpretive Tool is an information system framework developed by the USDA-ARS Jornada Experimental Range, USDA Natural Resources Conservation Service, and New Mexico State University.
Click on box and path labels to scroll to the respective text.