Natural Resources
Conservation Service
Ecological site F035XC323AZ
Sandy Upland 10-14" p.z. (JUOS)
Last updated: 5/20/2025
Accessed: 05/21/2025
General information
Provisional. A provisional ecological site description has undergone quality control and quality assurance review. It contains a working state and transition model and enough information to identify the ecological site.
MLRA notes
Major Land Resource Area (MLRA): 035X–Colorado Plateau
AZ CRA 35.3 – Colorado Plateau Sagebrush – Grasslands
Elevations range from 4500 to 6000 feet and precipitation averages 10 to 14 inches. Vegetation includes Wyoming big sagebrush, Utah juniper, Colorado pinyon - cliffrose, Mormon tea, fourwing saltbush, blackbrush Indian ricegrass, needle and thread, western wheatgrass Galleta, black grama, blue grama, and sand dropseed. The soil temperature regime is mesic and the soil moisture regime is ustic aridic. This unit occurs within the Colorado Plateau Physiographic Province and is characterized by a sequence of flat to gently dipping sedimentary rocks eroded into plateaus, valleys and deep canyons. Sedimentary rock classes dominate the plateau with volcanic fields occurring for the most part near its margin.
Table 1. Dominant plant species
| Tree |
(1) Juniperus osteosperma |
|---|---|
| Shrub |
(1) Artemisia tridentata ssp. wyomingensis |
| Herbaceous |
(1) Achnatherum hymenoides |
Physiographic features
This ecological site is found on nearly level to gently rolling partially stabilized or stabilized dunes on fan terraces and stream terraces. The soil associated with the site is moderately deep to any plant root restricting layer. The surface texture of the soil is generally fine sand or loamy sand. Subsurface horizons are generally fine sand or loamy sand. The slope of the site is generally 1 to 10 percent, but may be as high as 20 percent.
Table 2. Representative physiographic features
| Landforms |
(1)
Terrace
(2) Plateau (3) Dune |
|---|---|
| Flooding duration | Extremely brief (0.1 to 4 hours) |
| Flooding frequency | None to rare |
| Elevation | 1,768 – 2,195 m |
| Slope | 0 – 20% |
| Aspect | Aspect is not a significant factor |
Climatic features
Winter summer moisture ratios range from 70:30 to 60:40. Late spring is usually the driest period, and early fall moisture can be sporadic. Summer rains fall from June through September; moisture originates in the Gulf of Mexico and creates convective, usually brief, intense thunderstorms. Cool season moisture from October through May tends to be frontal; it originates in the Pacific and the Gulf of California and falls in widespread storms with longer duration and lower intensity. Precipitation generally comes as snow from December through February. Accumulations above 12 inches are not common but can occur. Snow usually lasts for 3-4 days, but can persist much longer. Summer daytime temperatures are commonly 95 - 100 F and on occasion exceed 105 F. Winter air temperatures can regularly go below 10 F and have been recorded below - 20 F.
Table 3. Representative climatic features
| Frost-free period (average) | 168 days |
|---|---|
| Freeze-free period (average) | 193 days |
| Precipitation total (average) | 356 mm |
Figure 1. Monthly precipitation range
Figure 2. Monthly average minimum and maximum temperature
Influencing water features
Soil features
The soil associated with this ecological are moderately deep to any plant root restricting layer (24 to 40”). The surface texture of the soil is generally fine sand or loamy sand. Subsurface horizons are generally fine sand or loamy sand. The soil ranges from slightly acid to moderately alkaline (pH 6.6 to 8.4). The permeability is rapid to very rapid and the soil profile can absorb all the moisture the climate can supply. The available water capacity is low. Wind erosion is a severe problem if the vegetative cover is lost.
Typical taxonomic units include:
SSA 625 Mohave County NE part MU 5 Begay;
SSA 711 Navajo Mountain Area MU 34 Pinavetes (moderately deep);
SSA 714 Hopi Area MU 16 Tonalea;
Table 4. Representative soil features
| Parent material |
(1)
Eolian sands
–
sandstone and shale
|
|---|---|
| Surface texture |
(1) Fine sand (2) Loamy sand |
| Family particle size |
(1) Sandy |
| Drainage class | Moderately well drained to somewhat excessively drained |
| Permeability class | Rapid to very rapid |
| Soil depth | 61 – 102 cm |
| Surface fragment cover <=3" | 0 – 2% |
| Surface fragment cover >3" | 0% |
| Available water capacity (0-101.6cm) |
3.81 – 10.41 cm |
| Calcium carbonate equivalent (0-101.6cm) |
1 – 4% |
| Electrical conductivity (0-101.6cm) |
0 – 2 mmhos/cm |
| Sodium adsorption ratio (0-101.6cm) |
0 – 2 |
| Soil reaction (1:1 water) (0-101.6cm) |
6.6 – 8.4 |
| Subsurface fragment volume <=3" (Depth not specified) |
0 – 2% |
| Subsurface fragment volume >3" (Depth not specified) |
0% |
Ecological dynamics
Plant Communities
Ecological Dynamics of the Site
The reference plant community/historic climax plant community (HCPC) for a site in North America is the plant community that existed at the time of European immigration and settlement. It is the plant community that was best adapted to the unique combination of environmental factors associated with the site. The historic climax plant community was in dynamic equilibrium with its environment. It is the plant community that was able to avoid displacement by the suite of disturbances and disturbance patterns (magnitude and frequency) that naturally occurred within the area occupied by the site. Natural disturbances, such as drought, fire, grazing of native fauna, and insects, were inherent in the development and maintenance of these plant communities. The effects of these disturbances are part of the range of characteristics of the site that contribute to that dynamic equilibrium. Fluctuations in plant community structure and function caused by the effects of these natural disturbances establish the boundaries of dynamic equilibrium. They are accounted for as part of the range of characteristics for an ecological site. Some sites may have a small range of variation, while others have a large range.
The historic climax plant community of an ecological site is not a precise assemblage of species for which the proportions are the same from place to place or from year to year. In all plant communities, variability is apparent in productivity and occurrence of individual species. Spatial boundaries of the communities; however, can be recognized by characteristic patterns of species composition, association, and community structure. The HCPC for this ecological site has been estimated by sampling relict or relatively undisturbed sites and/or reviewing historic records.
Plant communities that are subjected to abnormal disturbances and physical site deterioration or that are protected from natural influences, such as fire and grazing, for long periods seldom typify the historic climax plant community. The physical site deterioration caused by the abnormal disturbance results in the crossing of a threshold or irreversible boundary to another state, or equilibrium, for the ecological site. There may be multiple thresholds and states possible for an ecological site, determined by the type and or severity of abnormal disturbance. The known states and transition pathways for this ecological site are described in the accompanying state and transition model.
The Plant Community Plant Species Composition table provides a list of species and each specie’s or group of species’ annual production in pounds per acre (air-dry weight) expected in a normal rainfall year. Low and high production yields represent the modal range of variability for that species or group of species across the extent of the ecological site.
The Annual Production by Plant Type table provides the median air-dry production and the fluctuations to be expected during favorable, normal, and unfavorable years.
The present plant community on an ecological site can be compared to the various common vegetation states that can exist on the site. The degree of similarity is expressed through a similarity index. To determine the similarity index, compare the production of each species to that shown in the plant community description. For each species, count no more than the maximum amount shown for the species, and for each group, count no more than the maximum shown for the group. Divide the resulting total by the total representative value shown in the Annual Production by Plant Type table for the reference plant community. Variations in production due to above or below normal rainfall, incomplete growing season or utilization must be corrected before comparing it to the site description. The Worksheet for Determining Similarity Index is useful in making these corrections. The accompanying growth curve can be used as a guide for estimating percent of growth completed.
The State and Transition model shows the most common occurring plant communities likely to be encountered on this ecological site. This model may not show every possible plant community, but only those that are most prevalent and observed through field inventory. As more data is collected and research is available, these plant communities may be revised, removed, and even added to reflect the ecological dynamics of this site.
State and transition model
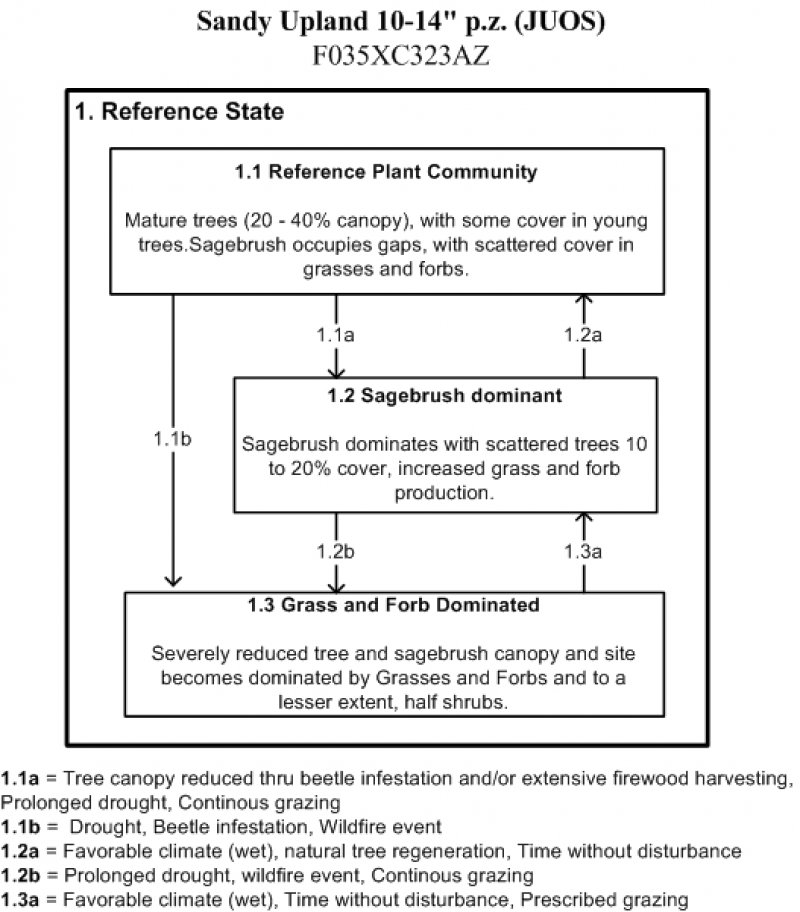
Figure 3. State and Transition Model - F035XC323AZ
More interactive model formats are also available.
View Interactive Models
More interactive model formats are also available.
View Interactive Models
Click on state and transition labels to scroll to the respective text
Ecosystem states
State 1 submodel, plant communities
State 1
Reference state
The dominant aspect of this site is a juniper woodland with some pinyon pine, perennial grasses, shrubs and forbs. The overstory canopy ranges averages 30%, ranging from 20 to 40%. Dominant understory species include Indian ricegrass, needle and thread, blue grama, galleta, Wyoming big sagebrush and Stansbury cliffrose. Plant composition for understory is 40% grasses, 5% forbs, 40% shrubs and 15% young trees. Common community pathways are droughts, fire, insect damage to trees (beetle infestation/kills) and firewood harvesting.
Community 1.1
Reference Plant Community
The dominant aspect of this plant community is a juniper woodland with some pinyon pine, perennial grasses, shrubs and forbs. The overstory crown canopy ranges averages 30%, ranging from 20 to 40%. Dominant understory species include Indian ricegrass, needle and thread, blue grama, galleta, Wyoming big sagebrush and Stansbury cliffrose. Plant composition for understory is 40% grasses, 5% forbs, 40% shrubs and 15% young trees.
Figure 4. Annual production by plant type (representative values) or group (midpoint values)
Table 5. Annual production by plant type
| Plant type | Low (kg/hectare) |
Representative value (kg/hectare) |
High (kg/hectare) |
|---|---|---|---|
| Shrub/Vine | 179 | 247 | 314 |
| Grass/Grasslike | 179 | 247 | 314 |
| Tree | 67 | 93 | 118 |
| Forb | 22 | 31 | 39 |
| Total | 447 | 618 | 785 |
Table 6. Ground cover
| Tree foliar cover | 0-40% |
|---|---|
| Shrub/vine/liana foliar cover | 0-2% |
| Grass/grasslike foliar cover | 0-7% |
| Forb foliar cover | 0-1% |
| Non-vascular plants | 0% |
| Biological crusts | 0% |
| Litter | 10-25% |
| Surface fragments >0.25" and <=3" | 0-2% |
| Surface fragments >3" | 0% |
| Bedrock | 0% |
| Water | 0% |
| Bare ground | 30-50% |
Table 7. Canopy structure (% cover)
| Height Above Ground (m) | Tree | Shrub/Vine | Grass/ Grasslike |
Forb |
|---|---|---|---|---|
| <0.15 | 5-10% | 0-5% | 0-5% | 0-1% |
| >0.15 <= 0.3 | 5-10% | 0-10% | 0-7% | 0-2% |
| >0.3 <= 0.6 | 10-20% | 0-10% | 0-1% | 0-2% |
| >0.6 <= 1.4 | 20-30% | – | – | – |
| >1.4 <= 4 | 20-30% | – | – | – |
| >4 <= 12 | 10-20% | – | – | – |
| >12 <= 24 | – | – | – | – |
| >24 <= 37 | – | – | – | – |
| >37 | – | – | – | – |
Figure 5. Plant community growth curve (percent production by month). AZ3511, 35.1 10-14" p.z. all sites. Growth begins in the spring and continues through the summer, most growth occurs during the summer rainy season. .
| Jan | Feb | Mar | Apr | May | Jun | Jul | Aug | Sep | Oct | Nov | Dec |
|---|---|---|---|---|---|---|---|---|---|---|---|
| J | F | M | A | M | J | J | A | S | O | N | D |
| 0 | 0 | 1 | 5 | 11 | 18 | 25 | 24 | 13 | 3 | 0 | 0 |
Figure 6. Plant community growth curve (percent production by month). AZ5102, 35.1 10-14" p.z. blue grama. Growth occurs mostly in summer and early fall during the rainy season..
| Jan | Feb | Mar | Apr | May | Jun | Jul | Aug | Sep | Oct | Nov | Dec |
|---|---|---|---|---|---|---|---|---|---|---|---|
| J | F | M | A | M | J | J | A | S | O | N | D |
| 0 | 0 | 0 | 5 | 5 | 15 | 30 | 30 | 15 | 0 | 0 | 0 |
Community 1.2
Sagebrush Dominant
Wyoming big sagebrush dominant the canopy with lighter overstory of scattered trees (10-20% canopy). Herbaceous cover is highly variable, but their is an increase in herbaceous production in this community.
Community 1.3
Grass and Forb Dominated
The dominant aspect of this plant community is a grassland with forbs. The woody canopy is severely reduced, less than 10%. Juniper, pinyon pine and Wyoming big sagebrush are still present but has decline significantly.
Pathway 1.1a
Community 1.1 to 1.2
Tree canopy is reduced thru disturbance such as drought, beetle infestion and/or extensive firewood harvesting.
Pathway 1.1b
Community 1.1 to 1.3
Tree and shrub canopies are severely reduced through a prolong drought, large wildfire, and/or beetle infestion.
Pathway 1.2a
Community 1.2 to 1.1
A favorable wet climate will promote tree regeneration in the absent of fire or beetle infestion along with a lack of surface disturbance or time with rest.
Pathway 1.2b
Community 1.2 to 1.3
Prolonged droughts, especially winter droughts will affect shrubs and trees most along with overstory canopy reduction thru wildfire/beetle kills/firewood harvesting. This reduces competition of resources and favors the increase and establishment of herbaceous plant species.
Pathway 1.3a
Community 1.3 to 1.2
A favorable wet climate will promote tree regeneration in the absent of fire or beetle infestion along with a lack of surface disturbance or time with rest.
Additional community tables
Table 8. Community 1.1 plant community composition
| Group | Common name | Symbol | Scientific name | Annual production (kg/hectare) | Foliar cover (%) | |
|---|---|---|---|---|---|---|
|
Grass/Grasslike
|
||||||
| 1 | Grasses | 179–314 | ||||
| Indian ricegrass | ACHY | Achnatherum hymenoides | 22–56 | 0–1 | ||
| needle and thread | HECOC8 | Hesperostipa comata ssp. comata | 22–56 | 0–1 | ||
| blue grama | BOGR2 | Bouteloua gracilis | 17–34 | 0–2 | ||
| squirreltail | ELELE | Elymus elymoides ssp. elymoides | 17–28 | 0–1 | ||
| Fendler's threeawn | ARPUF | Aristida purpurea var. fendleriana | 17–28 | 0–1 | ||
| Grass, perennial | 2GP | Grass, perennial | 17–28 | 0–1 | ||
| sandhill muhly | MUPU2 | Muhlenbergia pungens | 17–28 | 0–1 | ||
| James' galleta | PLJA | Pleuraphis jamesii | 17–28 | 0–1 | ||
| sand dropseed | SPCR | Sporobolus cryptandrus | 17–28 | 0–1 | ||
| black grama | BOER4 | Bouteloua eriopoda | 0–11 | 0–1 | ||
|
Forb
|
||||||
| 2 | Forbs | 22–39 | ||||
| Wyoming Indian paintbrush | CALI4 | Castilleja linariifolia | 9–17 | 0–1 | ||
| James' cryptantha | CRCIJ | Cryptantha cinerea var. jamesii | 6–17 | 0–1 | ||
| Forb, perennial | 2FP | Forb, perennial | 2–11 | 0–1 | ||
|
Shrub/Vine
|
||||||
| 3 | Shrubs | 179–314 | ||||
| Wyoming big sagebrush | ARTRW8 | Artemisia tridentata ssp. wyomingensis | 22–45 | 0–5 | ||
| Stansbury cliffrose | PUST | Purshia stansburiana | 22–45 | 0–5 | ||
| Shrub (>.5m) | 2SHRUB | Shrub (>.5m) | 13–22 | 1–5 | ||
| fourwing saltbush | ATCA2 | Atriplex canescens | 13–22 | 0–2 | ||
| Greene's rabbitbrush | CHGR6 | Chrysothamnus greenei | 13–22 | 0–2 | ||
| Cutler's jointfir | EPCU | Ephedra cutleri | 13–22 | 0–2 | ||
| mormon tea | EPVI | Ephedra viridis | 13–22 | 0–1 | ||
| rubber rabbitbrush | ERNAB2 | Ericameria nauseosa ssp. nauseosa var. bigelovii | 13–22 | 0–1 | ||
| broom snakeweed | GUSA2 | Gutierrezia sarothrae | 13–22 | 0–1 | ||
| Utah serviceberry | AMUT | Amelanchier utahensis | 13–22 | 0–1 | ||
| antelope bitterbrush | PUTR2 | Purshia tridentata | 13–22 | 0–1 | ||
| narrowleaf yucca | YUAN2 | Yucca angustissima | 6–11 | 0–1 | ||
| sand sagebrush | ARFI2 | Artemisia filifolia | 0–6 | 0–1 | ||
|
Tree
|
||||||
| 4 | Trees | 67–118 | ||||
| Utah juniper | JUOS | Juniperus osteosperma | 39–67 | 15–25 | ||
| twoneedle pinyon | PIED | Pinus edulis | 28–50 | 5–10 | ||
Interpretations
Animal community
When this site is grazed yearlong or primarily in the spring, cool season mid grasses that are most readily damaged by grazing decline and less productive species dominate the plant community. Most vegetation is palatable to livestock.
Wildlife adapted to this site will benefit from practices that will restore or maintain the native plant community. Wildlife watering facilities are important to the site.
Recreational uses
Landscape has high aesthetic appeal, particularly where it borders open grasslands for contrast. Activities include hunting, hiking, and photography.
Wood products
Firewood, fence posts. Fuel wood cords per acre = 3 - 5. Fence posts per acre = 0 - 10.
Other products
Personal firewood, pinyon nuts and mining.
Christmas trees at 0 - 10 per acre.
Other information
Woodland Uses and Interpretations
Equipment Suitability:
Harvesting: all kinds (Rubber tired equipment best)
Site Preparation: all kinds
Tree Planting: all kinds
Precommercial thinning: all kinds
Equipment Limitations:
Slope: slopes >15% in the sandy soils can limit equipment
Unsurfaced roads: Sand may become difficult to drive during dry times
Stoniness/Rock Outcrop: None
Water Table/Flooding: None
Erosion potentials:
Cutover areas/bare ground: Water erosion can be severe and wind erosion is very high in this sandy soil
Roads/Trails/Landings: Water-severe, wind very high
Soil Management:
Compaction potential: Low (sand does not compact well)
Rutting potential: Some rutting may occur
Revegetation potential: Poor (somewhat droughty soil)
Silviculture potentials & limitations:
Harvest Cutting: harvesting should be limited because of the low productivity of the site
Thinning & Improvement: Harvesting dead trees for fuelwood will improve the aesthetics of the site
Prescribed burning: not recommended
Mechanical Tree Removal: no restriction except for slopes > 15%
Pest Control: Control pests to prevent tree damage & loss
Fire Hazard: Low (fuel load low)
Suitability for replanting: Low (soils are droughty)
Seedling Mortality: Severe (low available water)
Natural Regeneration: Very slow (but will occur in time)
Seedling Protection: Seedlings should be protected from grazing and trampling
Plant competition: Severe (droughty soil)
Windthrow Hazard: None
Supporting information
Type locality
| Location 1: Coconino County, AZ | |
|---|---|
| UTM zone | N |
| UTM northing | 4049258 |
| UTM easting | 506295 |
| General legal description | White Mesa, Navajo Indian Reservation, AZ |
Other references
Information and updates collected during 2009-2010 for this ESD was conducted as part of an Interagency Technical Assistance Agreement between the Bureau of Indian Affairs–Navajo Region and the NRCS-Arizona.
Contributors
Dean Schlichting
Larry D. Ellicott
Approval
Kendra Moseley, 5/20/2025
Rangeland health reference sheet
Interpreting Indicators of Rangeland Health is a qualitative assessment protocol used to determine ecosystem condition based on benchmark characteristics described in the Reference Sheet. A suite of 17 (or more) indicators are typically considered in an assessment. The ecological site(s) representative of an assessment location must be known prior to applying the protocol and must be verified based on soils and climate. Current plant community cannot be used to identify the ecological site.
| Author(s)/participant(s) | |
|---|---|
| Contact for lead author | |
| Date | 05/21/2025 |
| Approved by | Kendra Moseley |
| Approval date | |
| Composition (Indicators 10 and 12) based on | Annual Production |
Indicators
-
Number and extent of rills:
-
Presence of water flow patterns:
-
Number and height of erosional pedestals or terracettes:
-
Bare ground from Ecological Site Description or other studies (rock, litter, lichen, moss, plant canopy are not bare ground):
-
Number of gullies and erosion associated with gullies:
-
Extent of wind scoured, blowouts and/or depositional areas:
-
Amount of litter movement (describe size and distance expected to travel):
-
Soil surface (top few mm) resistance to erosion (stability values are averages - most sites will show a range of values):
-
Soil surface structure and SOM content (include type of structure and A-horizon color and thickness):
-
Effect of community phase composition (relative proportion of different functional groups) and spatial distribution on infiltration and runoff:
-
Presence and thickness of compaction layer (usually none; describe soil profile features which may be mistaken for compaction on this site):
-
Functional/Structural Groups (list in order of descending dominance by above-ground annual-production or live foliar cover using symbols: >>, >, = to indicate much greater than, greater than, and equal to):
Dominant:
Sub-dominant:
Other:
Additional:
-
Amount of plant mortality and decadence (include which functional groups are expected to show mortality or decadence):
-
Average percent litter cover (%) and depth ( in):
-
Expected annual annual-production (this is TOTAL above-ground annual-production, not just forage annual-production):
-
Potential invasive (including noxious) species (native and non-native). List species which BOTH characterize degraded states and have the potential to become a dominant or co-dominant species on the ecological site if their future establishment and growth is not actively controlled by management interventions. Species that become dominant for only one to several years (e.g., short-term response to drought or wildfire) are not invasive plants. Note that unlike other indicators, we are describing what is NOT expected in the reference state for the ecological site:
-
Perennial plant reproductive capability:
Print Options
Sections
Font
Other
The Ecosystem Dynamics Interpretive Tool is an information system framework developed by the USDA-ARS Jornada Experimental Range, USDA Natural Resources Conservation Service, and New Mexico State University.
Click on box and path labels to scroll to the respective text.