Natural Resources
Conservation Service
Ecological site R023XY612OR
PUMICE SOUTH SLOPES 10-14 PZ
Last updated: 4/10/2025
Accessed: 05/20/2025
General information
Provisional. A provisional ecological site description has undergone quality control and quality assurance review. It contains a working state and transition model and enough information to identify the ecological site.
Ecological site concept
Currently there is only a draft of the initial concept for this ecological site. The initial concept for this site places it within the Loamy 10-20 PZ Mountain Big Sagebrush and Bluebunch Wheatgrass Ecological Site Group. To view the General STM and other information available for this ESG please go to https://edit.jornada.nmsu.edu/catalogs/esg/023X/R023XY905NV
Table 1. Dominant plant species
| Tree |
Not specified |
|---|---|
| Shrub |
Not specified |
| Herbaceous |
Not specified |
Physiographic features
This site occurs on moderately steep south facing slopes of canyons, buttes, and ridges. Slopes range from 15-65% but are typically from 30-60%. Elevations range from 2500-4500 feet.
Table 2. Representative physiographic features
| Landforms |
(1)
Canyon
(2) Butte (3) Ridge |
|---|---|
| Elevation | 2,500 – 4,500 ft |
| Slope | 15 – 65% |
| Aspect | S |
Climatic features
The annual precipitation averages 10-15 inches, most of which occurs during the months of October through March. The mean annual air temperature is 48 degrees F. Temperature extremes range from 110 to -30 degrees F. The period for optimum plant growth is from April through July.
Table 3. Representative climatic features
| Frost-free period (average) | 120 days |
|---|---|
| Freeze-free period (average) | 150 days |
| Precipitation total (average) | 14 in |
Influencing water features
Soil features
The soils of this site have sandy loam surface layers and subsoils. They are usually stony to very stony on the surface and throughout the profile. Colluvial rock material limits the effective depth to less than 30 inches. Depth to bedrock ranges from 10-40 inches. Permeability is moderate to rapid and the available water holding capacity is 2-6 inches for the profile. The potential for water erosion is high.
Table 4. Representative soil features
| Surface texture |
(1) Stony sandy loam |
|---|---|
| Family particle size |
(1) Loamy |
| Drainage class | Well drained |
| Permeability class | Moderate to rapid |
| Soil depth | 10 – 40 in |
| Available water capacity (0-40in) |
2 – 6 in |
| Calcium carbonate equivalent (0-40in) |
2% |
| Electrical conductivity (0-40in) |
Not specified |
| Sodium adsorption ratio (0-40in) |
Not specified |
| Soil reaction (1:1 water) (0-40in) |
7 |
Ecological dynamics
Five states have been identified for this site: a reference state; a state with the presence of annuals; a state that has Juniper dominating site resources; a state that is Juniper dominant; and a state with annual dominance.
Reference: Plant community phase change is driven by fire. Mountain and basin big sagebrush declines after fire while Idaho fescue, Thurber’s needlegrass and other grasses increase. May see a temporary increase in rabbitbrush after fire. Time facilitates the reintroduction of sagebrush. The introduction of invasive annual grasses and forbs transitions into the state 2.
State 2: Compositionally similar to the reference state with a trace of cheatgrass and the annual weeds. Ecological function has not changed, however the resiliency of the state has been reduced by the presence of invasive weeds. Prescribed grazing maintains state dynamics. Mismanagement of grazing favors sagebrush and Sandberg’s bluegrass. Cheatgrass increases. Prescribed grazing can reverse the trend. Reduction in fire frequency facilitates juniper encroachment in both poor and good condition communities. Fire reduces or eliminates juniper and with time sagebrush reestablishes. Juniper is out-competing sagebrush and the herbaceous plant community which brings the site to state 3.
State 3: Juniper dominates site resources. Sagebrush is dead or dying and bitterbrush lacks vigor. Sandberg’s bluegrass is the dominant species in the interspace and bare ground is significant. The perennial grass component is significantly reduced in both density and productivity. Idaho fescue may be present under the canopy of trees (north slope typically). Spatial and temporal energy capture and nutrient cycling has been truncated. Infiltration may be reduced due to lack of ground cover. Juniper woodland development is complete and soil loss and erosion drive site processes as the site goes into state 4.
State 4: Juniper dominated state. Soil loss is evident and erosion is active. All ecological processes, hydrologic cycle, nutrient cycle and energy capture have been significantly changed preventing the establishment of perennial plants. An abiotic threshold has been crossed. With catastrophic wildfire, state 5 is achieved.
State 5: Cheatgrass dominated plant community with limited to no shrub or perennial grass component. Soil erosion and redistribution along with changes in dynamic soil properties affect the hydrologic cycle and thus the nutrient cycle. Harsh environmental factors increase state resiliency to change.
State and transition model
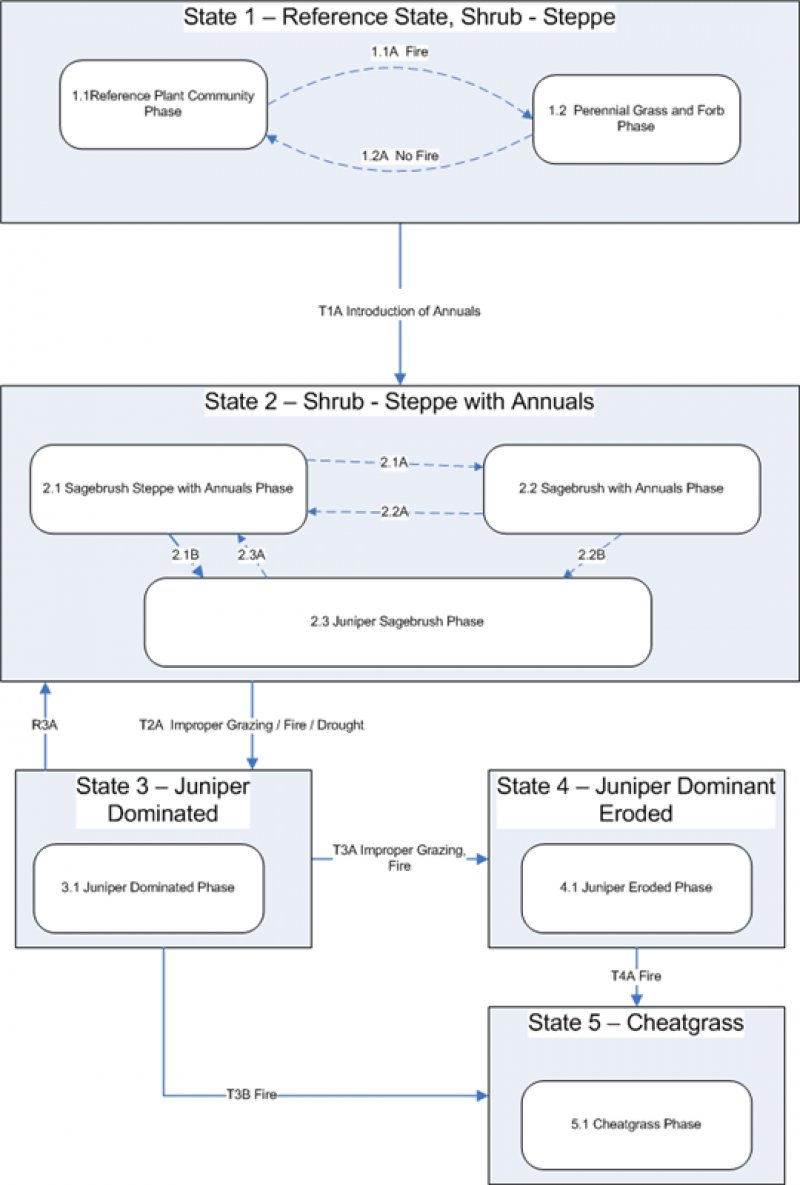
Figure 1. Group 8, STM
More interactive model formats are also available.
View Interactive Models
More interactive model formats are also available.
View Interactive Models
Click on state and transition labels to scroll to the respective text
Ecosystem states
State 1 submodel, plant communities
State 1
Historic Climax Plant Community
Community 1.1
Historic Climax Plant Community
HCPC
Figure 2. Annual production by plant type (representative values) or group (midpoint values)
Table 5. Annual production by plant type
| Plant type | Low (lb/acre) |
Representative value (lb/acre) |
High (lb/acre) |
|---|---|---|---|
| Grass/Grasslike | 490 | 525 | 560 |
| Shrub/Vine | 105 | 140 | 175 |
| Forb | 18 | 35 | 53 |
| Total | 613 | 700 | 788 |
Additional community tables
Table 6. Community 1.1 plant community composition
| Group | Common name | Symbol | Scientific name | Annual production (lb/acre) | Foliar cover (%) | |
|---|---|---|---|---|---|---|
|
Grass/Grasslike
|
||||||
| 1 | 263–368 | |||||
| Idaho fescue | FEID | Festuca idahoensis | 210–263 | – | ||
| bluebunch wheatgrass | PSSPS | Pseudoroegneria spicata ssp. spicata | 53–105 | – | ||
| 2 | 53–131 | |||||
| Sandberg bluegrass | POSE | Poa secunda | 26–53 | – | ||
| Thurber's needlegrass | ACTH7 | Achnatherum thurberianum | 5–26 | – | ||
| squirreltail | ELEL5 | Elymus elymoides | 11–26 | – | ||
| prairie Junegrass | KOMA | Koeleria macrantha | 11–26 | – | ||
|
Forb
|
||||||
| 3 | 0–16 | |||||
| common yarrow | ACMI2 | Achillea millefolium | 0–2 | – | ||
| woollypod milkvetch | ASPU9 | Astragalus purshii | 0–2 | – | ||
| tapertip hawksbeard | CRAC2 | Crepis acuminata | 0–2 | – | ||
| fleabane | ERIGE2 | Erigeron | 0–2 | – | ||
| buckwheat | ERIOG | Eriogonum | 0–2 | – | ||
| desertparsley | LOMAT | Lomatium | 0–2 | – | ||
| phacelia | PHACE | Phacelia | 0–2 | – | ||
| phlox | PHLOX | Phlox | 0–2 | – | ||
|
Shrub/Vine
|
||||||
| 4 | 7–21 | |||||
| mountain big sagebrush | ARTRV | Artemisia tridentata ssp. vaseyana | 7–14 | – | ||
| antelope bitterbrush | PUTR2 | Purshia tridentata | 0–7 | – | ||
| 5 | 12–28 | |||||
| yellow rabbitbrush | CHVI8 | Chrysothamnus viscidiflorus | 3–7 | – | ||
| buckwheat | ERIOG | Eriogonum | 3–7 | – | ||
| rubber rabbitbrush | ERNA10 | Ericameria nauseosa | 3–7 | – | ||
| desert gooseberry | RIVE | Ribes velutinum | 3–7 | – | ||
Interpretations
Animal community
Livestock- This site is suited for use by cattle, sheep, and horses under a planned grazing system in the spring and fall.
Wildlife- This site is commonly used by mule deer, rabbits, rodents, an assorted variety of birds and their associated avian and terrestrial predators.
Hydrological functions
The soils of this site have slow to very rapid runoff potential. The hydrologic cover is fair when ecological condition is high. The hydrologic soil group is B.
Wood products
This site is susceptible to invasion by western juniper. If this occurs, it can provide firewood and fence posts.
Other information
Bluebunch wheatgrass is the dominant grass, but Thurber needlegrass increases with more sandy surface textures. Antelope bitterbrush may increase as precipitation approaches 12 inches.
Fires causes a decline in sagebrush, but increases in rabbitbrush due to resprouting. Cheatgrass may invade in burned areas.
Supporting information
Contributors
C Tackman
Approval
Kendra Moseley, 4/10/2025
Rangeland health reference sheet
Interpreting Indicators of Rangeland Health is a qualitative assessment protocol used to determine ecosystem condition based on benchmark characteristics described in the Reference Sheet. A suite of 17 (or more) indicators are typically considered in an assessment. The ecological site(s) representative of an assessment location must be known prior to applying the protocol and must be verified based on soils and climate. Current plant community cannot be used to identify the ecological site.
| Author(s)/participant(s) | |
|---|---|
| Contact for lead author | |
| Date | 04/11/2025 |
| Approved by | Kendra Moseley |
| Approval date | |
| Composition (Indicators 10 and 12) based on | Annual Production |
Indicators
-
Number and extent of rills:
-
Presence of water flow patterns:
-
Number and height of erosional pedestals or terracettes:
-
Bare ground from Ecological Site Description or other studies (rock, litter, lichen, moss, plant canopy are not bare ground):
-
Number of gullies and erosion associated with gullies:
-
Extent of wind scoured, blowouts and/or depositional areas:
-
Amount of litter movement (describe size and distance expected to travel):
-
Soil surface (top few mm) resistance to erosion (stability values are averages - most sites will show a range of values):
-
Soil surface structure and SOM content (include type of structure and A-horizon color and thickness):
-
Effect of community phase composition (relative proportion of different functional groups) and spatial distribution on infiltration and runoff:
-
Presence and thickness of compaction layer (usually none; describe soil profile features which may be mistaken for compaction on this site):
-
Functional/Structural Groups (list in order of descending dominance by above-ground annual-production or live foliar cover using symbols: >>, >, = to indicate much greater than, greater than, and equal to):
Dominant:
Sub-dominant:
Other:
Additional:
-
Amount of plant mortality and decadence (include which functional groups are expected to show mortality or decadence):
-
Average percent litter cover (%) and depth ( in):
-
Expected annual annual-production (this is TOTAL above-ground annual-production, not just forage annual-production):
-
Potential invasive (including noxious) species (native and non-native). List species which BOTH characterize degraded states and have the potential to become a dominant or co-dominant species on the ecological site if their future establishment and growth is not actively controlled by management interventions. Species that become dominant for only one to several years (e.g., short-term response to drought or wildfire) are not invasive plants. Note that unlike other indicators, we are describing what is NOT expected in the reference state for the ecological site:
-
Perennial plant reproductive capability:
Print Options
Sections
Font
Other
The Ecosystem Dynamics Interpretive Tool is an information system framework developed by the USDA-ARS Jornada Experimental Range, USDA Natural Resources Conservation Service, and New Mexico State University.
Click on box and path labels to scroll to the respective text.