Natural Resources
Conservation Service
Ecological site R028AY025UT
Lakeshore Marsh
Last updated: 6/12/2025
Accessed: 10/20/2025
General information
Provisional. A provisional ecological site description has undergone quality control and quality assurance review. It contains a working state and transition model and enough information to identify the ecological site.
MLRA notes
Major Land Resource Area (MLRA): 028A–Ancient Lake Bonneville
MLRA 28A occurs in Utah (82 percent), Nevada (16 percent), and Idaho (2 percent). It encompasses approximately 36,775 square miles (95,246 square kilometers). A large area west and southwest of Great Salt Lake is a salty playa. This area is the farthest eastern extent of the Great Basin Section of the Basin and Range Province of the Intermontane Plateaus. It is an area of nearly level basins between widely separated mountain ranges trending north to south. The basins are bordered by long, gently sloping alluvial fans. The mountains are uplifted fault blocks with steep side slopes. Most of the valleys are closed basins containing sinks or playa lakes. Elevation ranges from 3,950 to 6,560 feet (1,204 to 2000 meters) in the basins and from 6,560 to 11,150 feet (1996 to 3398 meters) in the mountains. Much of the MLRA has alluvial valley fill and playa lakebed deposits at the surface from pluvial Lake Bonneville, which dominated this MLRA 13,000 years ago. A level line of remnant lake terraces on some mountain slopes indicates the former extent of this glacial lake. The Great Salt Lake is what remains of the pluvial lake.
Mountains in the interior of this MLRA consist of tilted blocks of marine sediments from Cambrian to Mississippian age with scattered outcrops of Tertiary continental sediments and volcanic rocks. The average annual precipitation is 5 to 12 inches (13 to 30 cm) in the valleys and ranges up to 49 inches (124 cm) in the mountains. Most of the rainfall in the southern LRU occurs as high-intensity, convective thunderstorms during the growing season (April through September). The driest period is from midsummer to early autumn in the northern LRU. Precipitation in winter typically occurs as snow. The average annual temperature is 39 to 53 °F (4 to 12 °C). The freeze-free period averages 165 days and ranges from 110 to 215 days, decreasing in length with increasing elevation. The dominant soil orders in this MLRA are Aridisols, Entisols, and Mollisols. Soils are dominantly in the mesic or frigid soil temperature regime, aridic or xeric soil moisture regime, and mixed mineralogy. The soils are generally well drained, loamy or loamy-skeletal, and very deep.
LRU notes
The Salt Desert/Wetland LRU consists of all the run-in ecological sites. Run-in sites occur in landform positions that receive additional moisture either through overland flow or subsurface water flow. Typical landforms are basin floors, lake plains, low lake terraces, depressional areas, drainageways, and flood plains. Sites within this LRU typically have water table depths of less than 60 inches (152 cm). Wetland plants, pickleweed (Salicornia sp.) and/or greasewood (Sarcorbatus vermiculatus) are dominant in the plant communities.
Ecological site concept
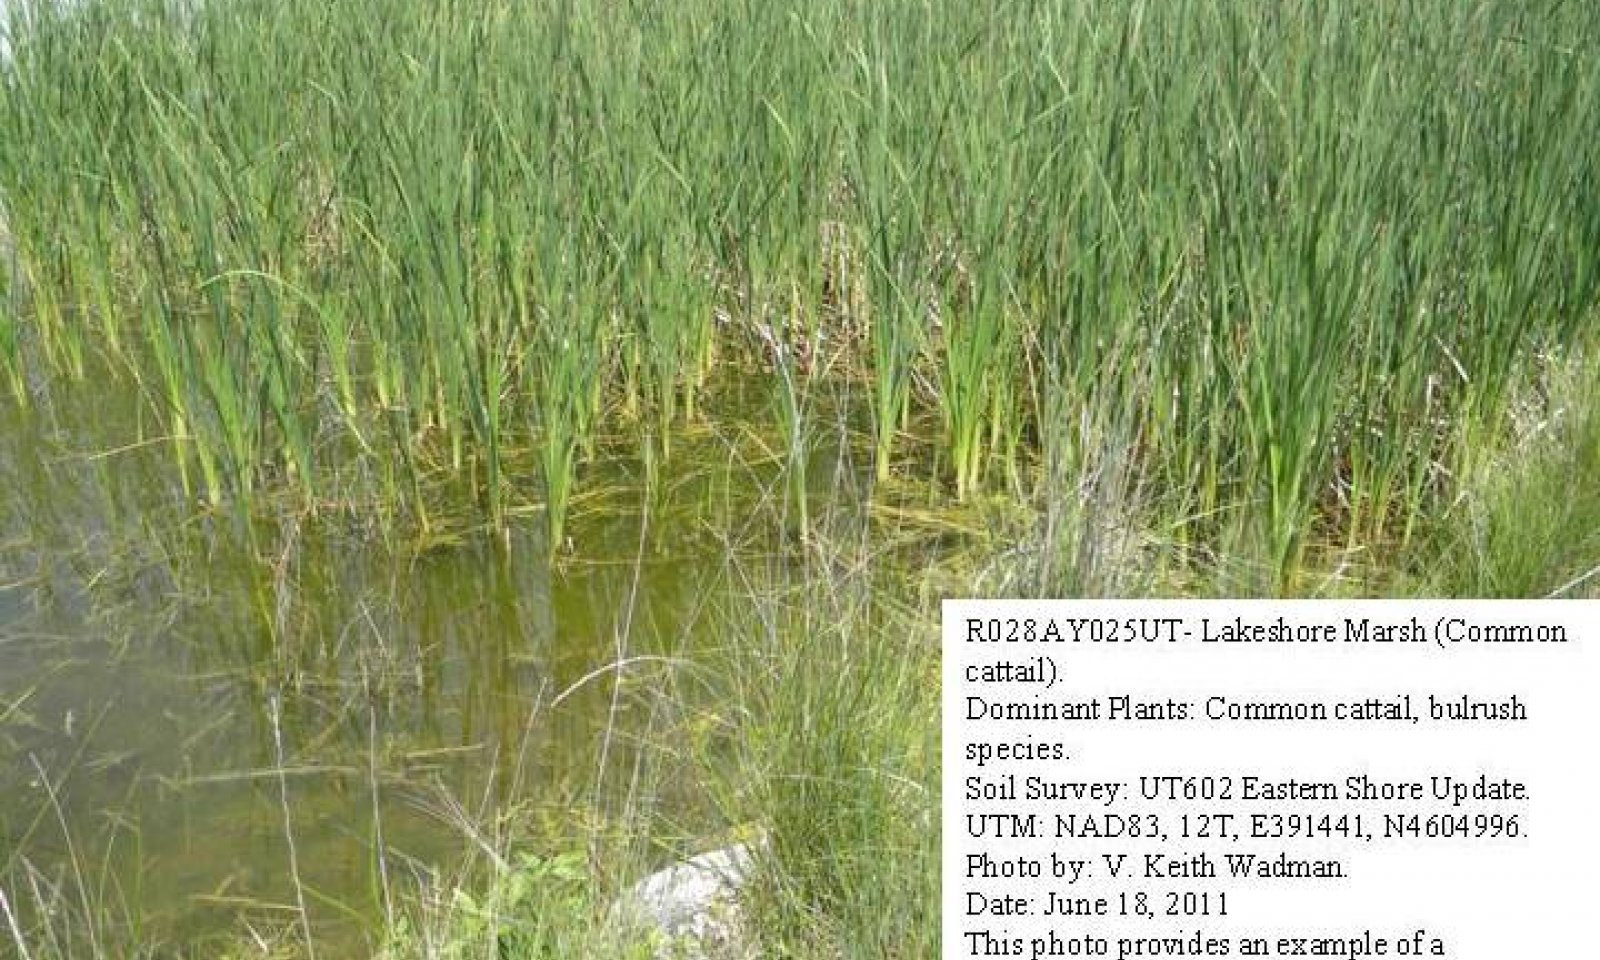
The Lakeshore Marsh ecological site occurs on lake fringes where the water is ponded for much of the growing season. The dominant plants are wetland obligate species, such as cattail (Typha latifolia) and bulrush (Schoenoplectus sp.). This site primarily occurs around the eastern shore of the Great Salt Lake.
Associated sites
| R028AY001UT |
Alkali Bottom (Alkali Sacaton) The Alkali Bottom site may occur up slope in drier soil. |
|---|---|
| R028AY004UT |
Alkali Flat (Black Greasewood) The Alkali Flat site may occur up slope from the Lakeshore Marsh site. |
| R028AY024UT |
Wet Saline Meadow (Saltgrass) The Wet Saline Meadow site may occur up slope in slightly drier soil conditions. |
| R028AY020UT |
Wet Fresh Meadow The Wet Fresh Meadow site may occur in drier soil up slope from the Lakeshore Marsh site. |
| R028AY131UT |
Desert Salty Silt (Pickleweed) The Desert Salty Silt site may occur adjacent to the Lakeshore Marsh site, but will have more salt influence. |
Similar sites
| R024XY127NV |
Lakeshore Marsh The Lakeshore Marsh site is copied from the MLRA 28A R028AY025UT site. |
|---|
Table 1. Dominant plant species
| Tree |
Not specified |
|---|---|
| Shrub |
Not specified |
| Herbaceous |
(1) Typha latifolia |
Physiographic features
The Lakeshore Marsh site is typically located on lake plains surrounding the Great Salt Lake. It typically occupies the area just below the Wet Saline Meadow ecological site and ends at open water. Slopes range from 0 to 3 percent. This site is subject to frequent ponding for long periods. Peak ponding period is from March thru September. It is not normally subject to flooding. Runoff is medium to high.
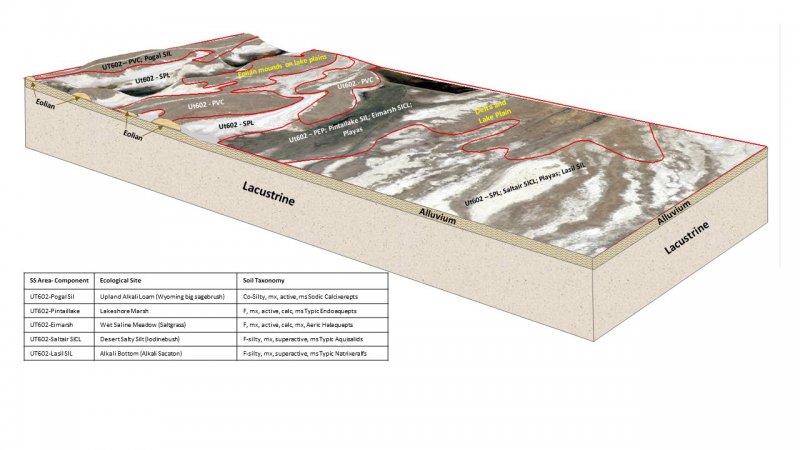
Figure 1.
Table 2. Representative physiographic features
| Landforms |
(1)
Lake plain
|
|---|---|
| Flooding frequency | None |
| Ponding duration | Very long (more than 30 days) |
| Ponding frequency | Frequent |
| Elevation | 4,190 – 4,290 ft |
| Slope | 3% |
| Ponding depth | 3 – 9 in |
| Water table depth | 10 in |
| Aspect | Aspect is not a significant factor |
Climatic features
The climate is dry subhumid and semiarid. It is characterized by cold, snowy winters and warm, dry summers. The average annual precipitation ranges from 14 to 18 inches. April and May are typically the wettest months with July and August being the driest. Precipitation consists of snow that accumulates over the winter, spring rains, and summer thunderstorms are intermittent and sporadic in nature. The mean annual air temperature is 48 to 52 degrees.
Table 3. Representative climatic features
| Frost-free period (characteristic range) | 110-171 days |
|---|---|
| Freeze-free period (characteristic range) | 150-208 days |
| Precipitation total (characteristic range) | 15-18 in |
| Frost-free period (actual range) | 100-172 days |
| Freeze-free period (actual range) | 149-219 days |
| Precipitation total (actual range) | 14-18 in |
| Frost-free period (average) | 140 days |
| Freeze-free period (average) | 180 days |
| Precipitation total (average) | 16 in |
Figure 2. Monthly precipitation range
Figure 3. Monthly minimum temperature range
Figure 4. Monthly maximum temperature range
Figure 5. Monthly average minimum and maximum temperature
Figure 6. Annual precipitation pattern
Figure 7. Annual average temperature pattern
Climate stations used
-
(1) BRIGHAM CITY WASTE PLT [USC00420928], Brigham City, UT
-
(2) CORINNE [USC00421731], Corinne, UT
-
(3) GARFIELD [USC00423097], Magna, UT
-
(4) BEAR RIVER BAY [USC00420490], Ogden, UT
Influencing water features
The Lakeshore Marsh site frequently ponds for very long periods during the months of March through September. Ponding depth is typically 3 to 9 inches. A water table is present during much of the year at a depth of 0 to 10 inches. Soil on this site is typically hydric.
Soil features
Characteristic soils are very deep and very poorly drained. The soil moisture and temperature regimes are typic aquic and mesic respectively. The soils formed in lacustrine deposits derived mainly from limestone, shale, or quartzite parent material. Soil textures are typically silt loams and silty clay loams. They are moderately saline (4 to 12 mmhos/cm) and moderately to strongly alkaline (7.9 - 9.0. Available water capacity ranges from 4 to 7 inches.
This site has been used in the following soil surveys and has been correlated to the following components:
UT602 - Box Elder County, Eastern Part - Pintail Lake.
UT607 - Davis-Weber - Pintail Lake.
UT611 - Tooele Area - Pintail Lake.
UT612 - Salt Lake Area - Pintail Lake.
Typical Profile (Pintail Lake):
Oi - 0-3 inches; silt loam; violently effervescent; moderately saline; moderately alkaline.
Ag - 3-10 inches; silt loam; violently effervescent; moderately saline; moderately alkaline.
Bg - 10-31 inches; silty clay loam; violently effervescent; strongly saline; strongly alkaline.
2BCg - 31-46 inches; silty clay; violently effervescent; strongly saline; moderately alkaline.
2Cgl - 46-55 inches; silty clay; strongly effervescent; strongly saline; moderately alkaline.
2Cg2 - 55-60 inches; silty clay; strongly effervescent; strongly saline; moderately alkaline.
Table 4. Representative soil features
| Parent material |
(1)
Lacustrine deposits
–
limestone and shale
|
|---|---|
| Surface texture |
(1) Silt loam (2) Silty clay loam |
| Family particle size |
(1) Clayey |
| Drainage class | Very poorly drained |
| Permeability class | Slow to very slow |
| Soil depth | 60 in |
| Surface fragment cover <=3" | 1% |
| Available water capacity (0-40in) |
4.1 – 7.3 in |
| Calcium carbonate equivalent (0-40in) |
20 – 30% |
| Electrical conductivity (0-40in) |
4 – 12 mmhos/cm |
| Sodium adsorption ratio (0-40in) |
13 – 30 |
| Soil reaction (1:1 water) (0-40in) |
7.9 – 9 |
Ecological dynamics
The Lakeshore Marsh site developed under the natural ecological conditions found in the Great Salt Lake Area of the Basin and Range Province, and includes the influence of the Great Salt Lakes natural water level fluctuations, waterfowl impacts, and climate. Vegetation is composed primarily of common cattail and various bulrush species, with hardstem and 3-square bulrushes found most often. The native sub-species of common reed is commonly found on the drier end of the site. On average years, plant growth begins after April 1st and continues throughout much of the summer and fall. The Lakeshore Marsh site typically has standing water up to 9 inches deep from March through September and on some sites, year round.
The Lakeshore Marsh site is of limited extent and is usually found adjacent to, and just below the Wet Saline Meadow (inland saltgrass) 028AY024UT ecological site. Saltgrass may extend into this site where ponding is less than three inches. The Lakeshore Marsh site typically ends with open water then the water depth becomes to great for plants to survive.
During periods of low standing water, total site production often decreases, but will return to normal amounts during years with average or above average site ponding.
The Great Salt Lake is an inland water body with no outlet and is thus highly affected by weather patterns that cause it the grow or shrink in size. As its shoreline moves up or down, ecological sites found along its shore must also migrate in their relationship to its shore. Water management has caused additional changes to the areas ecology by developing a series of canals, dikes and diversions designed to control and manage the lakes incoming water. In spite of these natural and human caused impacts, distinct ecological sites can be found surrounding this body of water.
Common reed (Phragmites australis) is an invasive grass that has colonized many areas in this ecological site. Phragmites can form dense mono-cultures that reduce plant diversity (Chambers et al. 1999). Dominance of Phragmites can also reduce waterfowl and shorebird use, decrease diversity of macroinvertebrates, alter hydrology, and increase fire hazards (see citations in Cranney 2016). Management of invasive Phragmites stands may include chemical, burning, and/or grazing/mowing treatments. Each of those treatments has varying success and stands of Phragmites may need a combination of treatments to control the spread (Cranney 2016).
The Lakeshore Marsh ecological site is commonly fenced into pasture units with other wetland sites. These pastures have been grazed by domestic livestock since they were first introduced into the area around 1860. This livestock introduction has influenced the disturbance regime historically associated with this group of ecological sites. These sites often serve as wintering pastures for sheep and cattle producers. Trailing through this site by livestock to obtain drinking water is common in these grazed pastures.
The Lakeshore Marsh site is very resistant to improperly managed livestock grazing because its principle species are not highly palatable. Mechanical damage to the site can occur however, when large numbers of livestock are allowed to camp there for long periods of time.
Waterfowl, including many species of geese and ducks use this site for nesting, hiding and resting. The Lakeshore Marsh site also provides prime nesting habitat for yellowheaded, redwing, and tricolored blackbirds.
As vegetative communities respond to changes in management or natural influences that move them from one state to another, a return to previous states may not be possible. The amount of energy needed to affect these vegetative shifts depends on present biotic and abiotic features and the desired results.
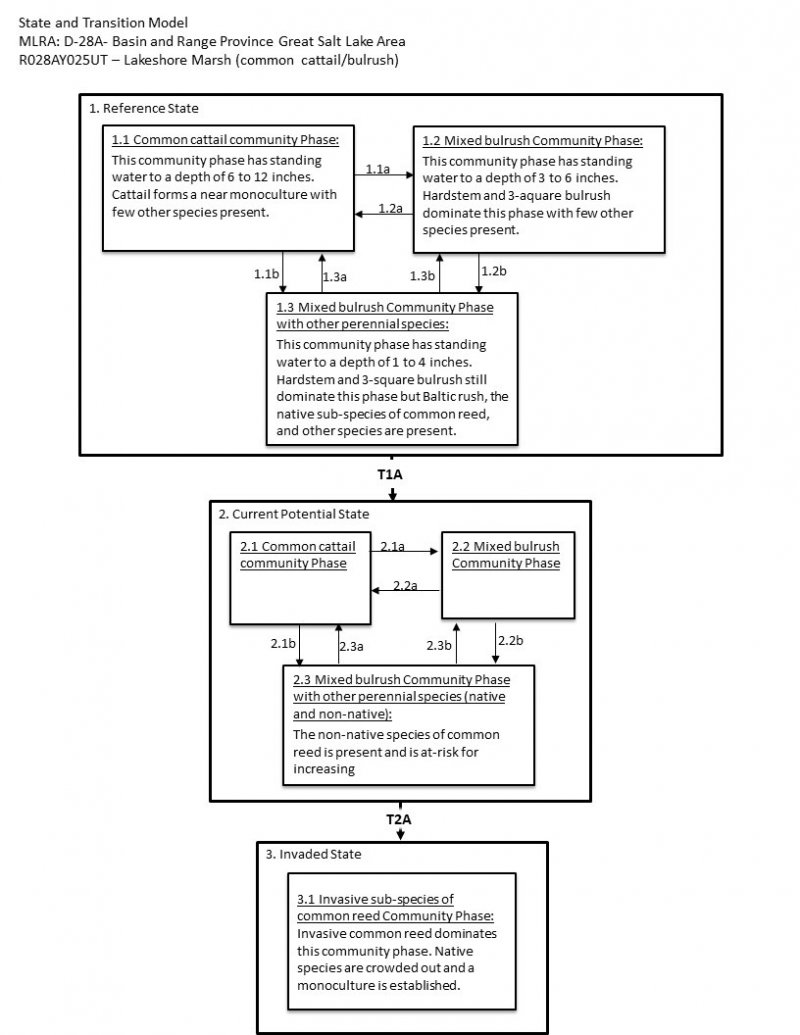
The following state and transition model diagram depicts some of the most commonly occurring plant communities found on this ecological site. These communities may not represent every possibility, but they are the most prevalent and repeatable. As more data are collected, some of these plant communities may be revised or removed, and new ones may be added. This model was developed using range data collected for publication of the Box Elder County, Eastern Part, Soil Survey and the recent Eastern Shores update. Both ocular and measured data was collected and utilized. Range data collected by the NRCS since 1983 was also used.
State and transition model
More interactive model formats are also available.
View Interactive Models
More interactive model formats are also available.
View Interactive Models
Click on state and transition labels to scroll to the respective text
Ecosystem states
State 1 submodel, plant communities
State 2 submodel, plant communities
State 3 submodel, plant communities
State 1
Reference State
The Reference State describes the natural biotic communities that may become established on the Lakeshore Marsh - cattail bulrush ecological site when all successional sequences are completed under the natural disturbance regime. The Reference State is self sustaining and resistant to change due to its high resistance to natural disturbances and high resilience following natural disturbances. When natural disturbances occur, the rate of recovery is variable due to disturbance intensity. Prolonged flooding could cause a large plant die-off at any community phase. This community could become at risk where increased disturbance and/or the introduction of the invasive species of common reed occurs. Once this invasive species becomes established, return to the reference state may not be possible. Reference State: Community phases influenced by fluctuating water levels, natural disturbances, and weather. Indicators: A dense stand of common cattail, various bulrush species and the native sub-species of common reed dominant visual aspect. Feedbacks: Extended drought, lower standing water levels and/or other disturbances that reduce plant vigor which may allow invasive species to become established in the community. Properly managed water levels where possible help maintain the native perennial plant community. At-risk Community Phase: All communities in this state are at risk when native plants are stressed and/or nutrients become available for invasive plants to establish. Trigger: Introduction and establishment of non-native invasive plants such as the invasive sub-species of common reed.
Community 1.1
Common Cattail Community Phase

Figure 8. Community Phase 1.1
The community is characterized by a perennial forb community dominated by common cattail, other species including hardstem and 3-square bulrush are present in small amounts. The Common Cattail Community normally has standing water 6 to 12 inches deep during all of the growing season. When the water depth exceeds 12 inches, open water results. Ground cover is highly variable with perennial vegetative cover ranging from 30 to 60 percent and litter ranging from 25 to 60 percent. Ponded water is also variable (20 to 60 percent).
Figure 9. Annual production by plant type (representative values) or group (midpoint values)
Table 5. Annual production by plant type
| Plant type | Low (lb/acre) |
Representative value (lb/acre) |
High (lb/acre) |
|---|---|---|---|
| Forb | 3000 | 4000 | 5000 |
| Grass/Grasslike | 100 | 200 | 300 |
| Total | 3100 | 4200 | 5300 |
Table 6. Ground cover
| Tree foliar cover | 0% |
|---|---|
| Shrub/vine/liana foliar cover | 0% |
| Grass/grasslike foliar cover | 5-10% |
| Forb foliar cover | 25-50% |
| Non-vascular plants | 0% |
| Biological crusts | 0% |
| Litter | 25-50% |
| Surface fragments >0.25" and <=3" | 0% |
| Surface fragments >3" | 0% |
| Bedrock | 0% |
| Water | 20-60% |
| Bare ground | 0% |
Community 1.2
Mixed Bulrush Community Phase
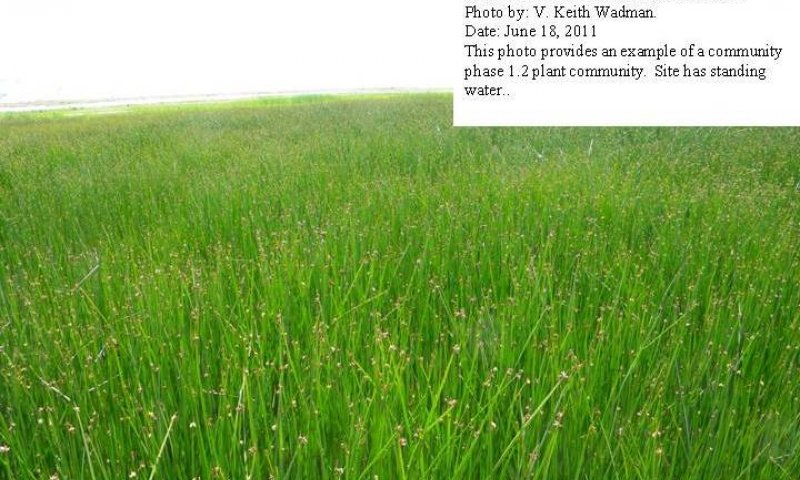
Figure 10. Community Phase 1.2
The community is characterized by a perennial sedge community dominated by hardstem and 3-square bulrush. Other species including fluted bulrush and common cattail are present in small amounts. The Mixed Bulrush Community Phase normally has standing water 3 to 6 inches deep during all of the growing season. When the water depth exceeds 6 inches, common cattail often dominates. Ground cover is highly variable with perennial vegetative cover ranging from 30 to 50 percent and litter ranging from 25 to 60 percent. Ponded water is also variable (20 to 60 percent).
Figure 11. Annual production by plant type (representative values) or group (midpoint values)
Table 7. Annual production by plant type
| Plant type | Low (lb/acre) |
Representative value (lb/acre) |
High (lb/acre) |
|---|---|---|---|
| Grass/Grasslike | 2200 | 3400 | 4200 |
| Forb | 100 | 150 | 250 |
| Total | 2300 | 3550 | 4450 |
Table 8. Ground cover
| Tree foliar cover | 0% |
|---|---|
| Shrub/vine/liana foliar cover | 0% |
| Grass/grasslike foliar cover | 25-40% |
| Forb foliar cover | 5-10% |
| Non-vascular plants | 0% |
| Biological crusts | 0% |
| Litter | 20-40% |
| Surface fragments >0.25" and <=3" | 0% |
| Surface fragments >3" | 0% |
| Bedrock | 0% |
| Water | 25-50% |
| Bare ground | 0% |
Community 1.3
Mixed Bulrush Community Phase with other Perennial Species
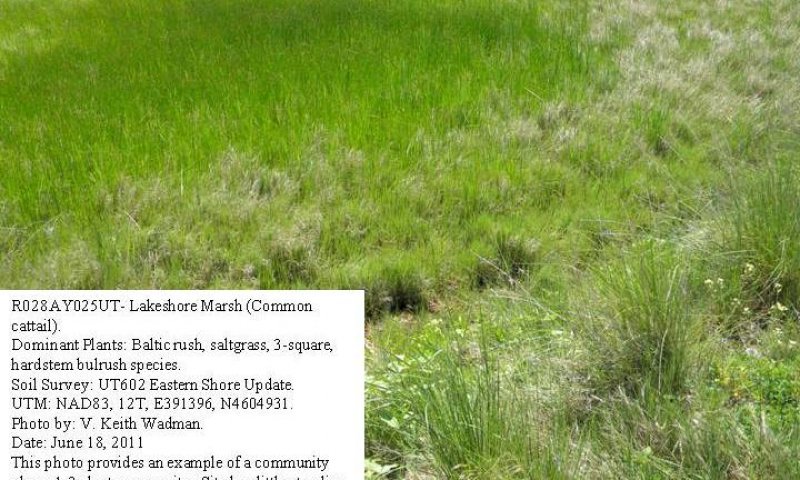
Figure 12. Community Phase 1.3
The Mixed Bulrush Community Phase is characterized by a perennial sedge community dominated by hardstem and 3-square bulrush. Other species including fluted bulrush and common cattail are present in small amounts. This site normally has standing water 1 to 3 inches deep during much of the growing season. Baltic rush, inland saltgrass, and the native sub-species of common reed are present and when conditions are right, may dominate the community. When the water depth exceeds 3 inches, these species are greatly reduced. Ground cover is highly variable with perennial vegetative cover ranging from 30 to 50 percent and litter ranging from 25 to 60 percent. Ponded water is also variable (20 to 60 percent).
Figure 13. Annual production by plant type (representative values) or group (midpoint values)
Table 9. Annual production by plant type
| Plant type | Low (lb/acre) |
Representative value (lb/acre) |
High (lb/acre) |
|---|---|---|---|
| Grass/Grasslike | 2200 | 2600 | 3000 |
| Forb | 120 | 150 | 200 |
| Total | 2320 | 2750 | 3200 |
Table 10. Ground cover
| Tree foliar cover | 0% |
|---|---|
| Shrub/vine/liana foliar cover | 0% |
| Grass/grasslike foliar cover | 25-40% |
| Forb foliar cover | 5-10% |
| Non-vascular plants | 0% |
| Biological crusts | 0% |
| Litter | 20-50% |
| Surface fragments >0.25" and <=3" | 0% |
| Surface fragments >3" | 0% |
| Bedrock | 0% |
| Water | 15-20% |
| Bare ground | 0% |
Pathway 1.1a
Community 1.1 to 1.2
This community pathway occurs when the stable standing water level decreases from 6 to 12 inches to 3 to 6 inches. This allows bulrushes and other species to more effectively compete with deeper water species such as common cattail. This change may be caused by natural lake fluctuations or by water management such as diking and water level manipulation.
Pathway 1.1b
Community 1.1 to 1.3
This community pathway occurs when the stable standing water level decreases from 6 to 12 inches to 1 to 4 inches. This allows bulrushes and other species including rushes, grasses and forbs to more effectively compete with deeper water species such as common cattail. This change may be caused by natural lake fluctuations or by water management such as diking and water level manipulation.
Pathway 1.2a
Community 1.2 to 1.1
This community pathway occurs when the stable standing water level increases to 6 to 12 inches from 3 to 6 inches. This allows common cattail to more effectively compete with shallower water species such as bulrushes. This change may be caused by natural lake fluctuations or by water management such as diking and water level manipulation.
Pathway 1.2b
Community 1.2 to 1.3
This community pathway occurs when the stable standing water level decreases from 3 to 6 inches to 1 to 4 inches. This allows species such as Baltic rush, inland saltgrass and forbs to more effectively compete with deeper water species such as bulrushes. This change may be caused by natural lake fluctuations or by water management such as diking and water level manipulation.
Pathway 1.3a
Community 1.3 to 1.1
This community pathway occurs when the stable standing water level increases to 6 to 12 inches from 1 to 4 inches. This allows common cattail to more effectively compete with shallower water species such as bulrushes, baltic rush and inland saltgrass. This change may be caused by natural lake fluctuations or by water management such as diking and water level manipulation.
Pathway 1.3b
Community 1.3 to 1.2
This community pathway occurs when the stable standing water level increases to 3 to 6 inches from 1 to 4 inches. This allows bulrush species to more effectively compete with shallower water species such as baltic rush and inland saltgrass. This change may be caused by natural lake fluctuations or by water management such as diking and water level manipulation.
State 2
Current Potential State
This state is similar to the Reference State with the addition of non-native species.
Community 2.1
Common cattail/non-natives
The Common cattail/non-natives community is characterized by a perennial forb community dominated by common cattail, other species including hardstem and 3-square bulrush are present in small amounts. This site normally has standing water 6 to 12 inches deep during all of the growing season. When the water depth exceeds 12 inches, open water results. Ground cover is highly variable with perennial vegetative cover ranging from 30 to 60 percent and litter ranging from 25 to 60 percent. Ponded water is also variable (20 to 60 percent).
Community 2.2
Mixed bulrush/non-natives
The Mixed bulrush/non-natives community is characterized by a perennial sedge community dominated by hardstem and 3-square bulrush. Other species including fluted bulrush and common cattail are present in small amounts. This site normally has standing water 3 to 6 inches deep during all of the growing season. When the water depth exceeds 6 inches, common cattail often dominates. Ground cover is highly variable with perennial vegetative cover ranging from 30 to 50 percent and litter ranging from 25 to 60 percent. Ponded water is also variable (20 to 60 percent).
Community 2.3
Mixed bulrush/other perennial species/non-natives
The Mixed bulrush/other perennial species/non-natives community is characterized by a perennial sedge community dominated by hardstem and 3-square bulrush. Other species including fluted bulrush and common cattail are present in small amounts. This site normally has standing water 1 to 3 inches deep during much of the growing season. Baltic rush, inland saltgrass and the native sub-species of common reed are present and when conditions are right, may dominate the community. When the water depth exceeds 3 inches, these species are greatly reduced. Ground cover is highly variable with perennial vegetative cover ranging from 30 to 50 percent and litter ranging from 25 to 60 percent. Ponded water is also variable (20 to 60 percent).
Pathway 2.1a
Community 2.1 to 2.2
This community pathway occurs when the stable standing water level decreases from 6 to 12 inches to 3 to 6 inches. This allows bulrushes and other species to more effectively compete with deeper water species such as common cattail. This change may be caused by natural lake fluctuations or by water management such as diking and water level manipulation.
Pathway 2.1b
Community 2.1 to 2.3
This community pathway occurs when the stable standing water level decreases from 6 to 12 inches to 1 to 4 inches. This allows bulrushes and other species including rushes, grasses and forbs to more effectively compete with deeper water species such as common cattail. This change may be caused by natural lake fluctuations or by water management such as diking and water level manipulation.
Pathway 2.2a
Community 2.2 to 2.1
This community pathway occurs when the stable standing water level increases to 6 to 12 inches from 3 to 6 inches. This allows common cattail to more effectively compete with shallower water species such as bulrushes. This change may be caused by natural lake fluctuations or by water management such as diking and water level manipulation.
Pathway 2.2b
Community 2.2 to 2.3
This community pathway occurs when the stable standing water level decreases from 3 to 6 inches to 1 to 4 inches. This allows species such as Baltic rush, inland saltgrass and forbs to more effectively compete with deeper water species such as bulrushes. This change may be caused by natural lake fluctuations or by water management such as diking and water level manipulation.
Pathway 2.3a
Community 2.3 to 2.1
This community pathway occurs when the stable standing water level increases to 6 to 12 inches from 1 to 4 inches. This allows common cattail to more effectively compete with shallower water species such as bulrushes, baltic rush and inland saltgrass. This change may be caused by natural lake fluctuations or by water management such as diking and water level manipulation.
Pathway 2.3b
Community 2.3 to 2.2
This community pathway occurs when the stable standing water level increases to 3 to 6 inches from 1 to 4 inches. This allows bulrush species to more effectively compete with shallower water species such as baltic rush and inland saltgrass. This change may be caused by natural lake fluctuations or by water management such as diking and water level manipulation.
State 3
Invaded State
The Invaded State is similar to the reference state, except that non-native and/or invasive species are present in all community phases. This state is generally dominated by the invasive sub-species of common reed; however, depending on disturbance history, species native to this site may be lacking resulting in pure stands of common reed. Primary disturbance mechanisms include climate fluctuations, water level changes, and surface disturbances such as road and pipeline development and off road vehicle (OHV) use. Timing of these disturbances dictates the ecological dynamics that can occur. The invaded state is losing resistance to change and lower resilience following disturbances. Indicators: A site dominated by common cattail and several bulrush species including hardstem and 3-square. Both the native and introduced subspecies of common reed are now present in the stand. Feedbacks: Extended drought resulting in a reduction of native perennial plant vigor. Normal fluctuations in weather allowing for the maintenance of both perennial sedges and grasses. At-risk Community Phase: This state is at risk when perennial plant cover is reduced and nutrients become available for invasive plants to flourish. Trigger: Spread of invasive plants to fill available niches.
Community 3.1
Invasive species of Common Reed Community Phase
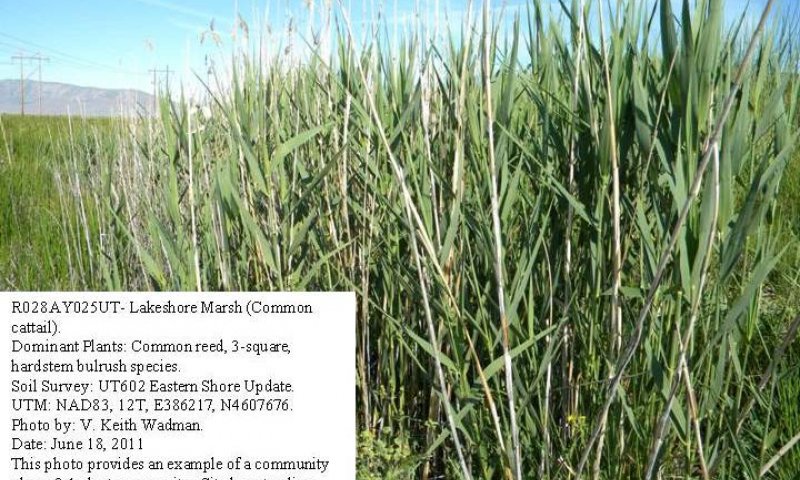
Figure 14. Community Phase 2.1
The Invasive species of Common Reed Community Phase is characterized by a significant invasion of the non-native sub-species of common reed replacing perennial grass/sedge communities normally dominating this site. Hardstem and 3-square bulrush and other species including fluted bulrush and common cattail may still be present in small amounts. This site normally has standing water 1 to 6 inches deep during much or all of the growing season. Baltic rush, inland saltgrass and the native sub-species of common reed are present when conditions are right. All of these species are in danger of being eliminated and replaced by the non-native reed species. Ground cover is highly variable with perennial vegetative cover ranging from 30 to 60 percent and litter ranging from 25 to 50 percent. Ponded water is also variable (15 to 20 percent).
Figure 15. Annual production by plant type (representative values) or group (midpoint values)
Table 11. Annual production by plant type
| Plant type | Low (lb/acre) |
Representative value (lb/acre) |
High (lb/acre) |
|---|---|---|---|
| Grass/Grasslike | 2200 | 2600 | 3000 |
| Forb | 120 | 150 | 200 |
| Total | 2320 | 2750 | 3200 |
Table 12. Ground cover
| Tree foliar cover | 0% |
|---|---|
| Shrub/vine/liana foliar cover | 0% |
| Grass/grasslike foliar cover | 35-55% |
| Forb foliar cover | 5-10% |
| Non-vascular plants | 0% |
| Biological crusts | 0% |
| Litter | 20-50% |
| Surface fragments >0.25" and <=3" | 0% |
| Surface fragments >3" | 0% |
| Bedrock | 0% |
| Water | 15-20% |
| Bare ground | 0% |
Transition T1A
State 1 to 2
This transition occurs when non-native species are introduced.
Transition T2A
State 2 to 3
This transition is from the native perennial plant communities in the reference state to a state that now contains invasive species. Events that allow for the establishment of invasive plant species include, prolonged drought, standing water level fluctuation, surface disturbances, etc. However, the invasive sub-species of common reed has been known to invade intact perennial plant communities with little to no disturbance. Once invasive species are found in the plant community a threshold has been crossed.
Additional community tables
Table 13. Community 1.1 plant community composition
| Group | Common name | Symbol | Scientific name | Annual production (lb/acre) | Foliar cover (%) | |
|---|---|---|---|---|---|---|
|
Forb
|
||||||
| 1 | Dominant Forbs | 3000–5500 | ||||
| broadleaf cattail | TYLA | Typha latifolia | 3000–5000 | – | ||
| southern cattail | TYDO | Typha domingensis | 200–400 | – | ||
|
Grass/Grasslike
|
||||||
| 2 | Dominant Grasslikes | 150–300 | ||||
| chairmaker's bulrush | SCAM6 | Schoenoplectus americanus | 100–200 | – | ||
| hardstem bulrush | SCACA | Schoenoplectus acutus var. acutus | 75–150 | – | ||
Table 14. Community 1.2 plant community composition
| Group | Common name | Symbol | Scientific name | Annual production (lb/acre) | Foliar cover (%) | |
|---|---|---|---|---|---|---|
|
Grass/Grasslike
|
||||||
| 1 | Dominant Grasslikes | 2000–4000 | ||||
| chairmaker's bulrush | SCAM6 | Schoenoplectus americanus | 1000–1500 | – | ||
| hardstem bulrush | SCACA | Schoenoplectus acutus var. acutus | 500–1000 | – | ||
|
Forb
|
||||||
| 2 | Dominant Forbs | 150–250 | ||||
| broadleaf cattail | TYLA | Typha latifolia | 100–200 | – | ||
| broadleaf cattail | TYLA | Typha latifolia | 100–200 | – | ||
| southern cattail | TYDO | Typha domingensis | 20–40 | – | ||
Table 15. Community 1.3 plant community composition
| Group | Common name | Symbol | Scientific name | Annual production (lb/acre) | Foliar cover (%) | |
|---|---|---|---|---|---|---|
|
Grass/Grasslike
|
||||||
| 1 | Dominant Grasses/Grasslikes | 2000–3000 | ||||
| hardstem bulrush | SCACA | Schoenoplectus acutus var. acutus | 300–500 | – | ||
| chairmaker's bulrush | SCAM6 | Schoenoplectus americanus | 300–500 | – | ||
| saltgrass | DISP | Distichlis spicata | 100–300 | – | ||
| common spikerush | ELPA3 | Eleocharis palustris | 100–200 | – | ||
| 3 | Sub-dominant Grasses/Grasslikes | 100–200 | ||||
| foxtail barley | HOJU | Hordeum jubatum | 0–40 | – | ||
| common reed | PHAU7 | Phragmites australis | 20–40 | – | ||
| annual rabbitsfoot grass | POMO5 | Polypogon monspeliensis | 0–20 | – | ||
| weeping alkaligrass | PUDI | Puccinellia distans | 0–20 | – | ||
| scratchgrass | MUAS | Muhlenbergia asperifolia | 0–20 | – | ||
| meadow barley | HOBRB2 | Hordeum brachyantherum ssp. brachyantherum | 0–20 | – | ||
|
Forb
|
||||||
| 2 | Dominant Forbs | 150–250 | ||||
| broadleaf cattail | TYLA | Typha latifolia | 50–74 | – | ||
| southern cattail | TYDO | Typha domingensis | 20–40 | – | ||
| swamp milkweed | ASIN | Asclepias incarnata | 0–20 | – | ||
| showy milkweed | ASSP | Asclepias speciosa | 0–20 | – | ||
| seaside arrowgrass | TRMA20 | Triglochin maritima | 0–20 | – | ||
Table 16. Community 3.1 plant community composition
| Group | Common name | Symbol | Scientific name | Annual production (lb/acre) | Foliar cover (%) | |
|---|---|---|---|---|---|---|
|
Grass/Grasslike
|
||||||
| 1 | Dominant Grasses/Grasslikes | 2000–3300 | ||||
| common reed | PHAU7 | Phragmites australis | 1000–2000 | – | ||
| hardstem bulrush | SCACA | Schoenoplectus acutus var. acutus | 200–400 | – | ||
| chairmaker's bulrush | SCAM6 | Schoenoplectus americanus | 200–400 | – | ||
| saltgrass | DISP | Distichlis spicata | 100–200 | – | ||
| common spikerush | ELPA3 | Eleocharis palustris | 100–200 | – | ||
| 2 | Sub-dominant Grasses/Grasslikes | 50–150 | ||||
| foxtail barley | HOJU | Hordeum jubatum | 0–40 | – | ||
| scratchgrass | MUAS | Muhlenbergia asperifolia | 0–20 | – | ||
| annual rabbitsfoot grass | POMO5 | Polypogon monspeliensis | 0–20 | – | ||
| weeping alkaligrass | PUDI | Puccinellia distans | 0–20 | – | ||
| meadow barley | HOBRB2 | Hordeum brachyantherum ssp. brachyantherum | 0–20 | – | ||
|
Forb
|
||||||
| 3 | Forbs | 150–250 | ||||
| broadleaf cattail | TYLA | Typha latifolia | 50–75 | – | ||
| southern cattail | TYDO | Typha domingensis | 20–40 | – | ||
| swamp milkweed | ASIN | Asclepias incarnata | 0–20 | – | ||
| showy milkweed | ASSP | Asclepias speciosa | 0–20 | – | ||
| seaside arrowgrass | TRMA20 | Triglochin maritima | 0–20 | – | ||
Interpretations
Animal community
--Threatened and Endangered Species--
This section will be populated as more information becomes available.
--Wildlife Interpretation--
The Lakeshore Marsh ecological site and associated other wetlands associated with the Great Salt Lake provide critical habitat for migrating birds from both the Pacific and Central Flyway of North America. This area contains abundant food for birds. Birds come to the Refuge by the millions to eat and rest during migration.
The following statistics were provided by the Bear River Migratory Bird Refuge where much of this ecological site is located:
1. Breeding colonies of white-faced ibis contain as many as 18,000 birds.
2. Up to 10,000 American avocets breed at the Refuge annually.
3. One of North America’s three largest American white pelican breeding colonies, containing in excess of 50,000 birds, is found on Gunnison Island in Great Salt Lake.
4. Northern Utah marshes host up to 60 percent of the continental breeding population of cinnamon teal.
5. The Great Salt Lake boasts the largest fall staging concentration of Wilson’s phalaropes in the world, at approximately 500,000 birds. Red-necked phalaropes number nearly 100,000.
6. The Great Salt Lake area hosts greater than 50 percent of the continental breeding population of snowy plovers.
7. The Great Salt Lake area hosts 26 percent of the global population of marbled godwits during migration.
8. Bear River Refuge may attract over 65,000 black-necked stilts in the fall, more than anywhere else in the country.
--Grazing Interpretations--
The Lakeshore Marsh site has limited potential for livestock grazing. It is primarily composed of cattail and bulrush species with low palatability. When present, grasses, primarily foxtail barley and saltgrass, can provide forage for horses, cattle, and sheep; however, many times these species are not abundant enough to support livestock. Grazing must be carefully planned and managed to prevent damage to the site. Before making specific grazing management recommendations, an onsite evaluation should be conducted as part of a science based grazing management plan.
Hydrological functions
The soils are generally in Hydrologic Soil Group D due to their high runoff potential when dry and a water table during much of the year at 8 to 10 inches (NRCS National Engineering Handbook). Hydrologic groups are used in equations that estimate runoff from rainfall. These estimates are needed for solving hydrologic problems that arise in planning watershed-protection and flood-prevention projects and for designing structures for the use, control and disposal of water. Surface disturbance can alter the hydrology by decreasing plant cover and increasing bare ground. Fire can also affect hydrology, but it is rare on this site. Fire intensity, fuel type, soil, climate, and topography can each have different influences. (National Range and Pasture Handbook, 2003)
Recreational uses
The Lakeshore Marsh ecological site provides nesting, hiding and forage for several species of both residential and migratory waterfowl as they pass through the area. This provides excellent opportunities for bird watching and waterfowl hunting where allowed.
Wood products
None.
Supporting information
Other references
Chambers RM, LA Meyerson, K Saltonstall. 1999. Expansion of Phragmites australis into tidal wetlands of North America. Aquatic Botany 64: 261-273.
Cranney, CR. 2016. Control of large stands of Phragmites australis in Great Salt Lake, Utah wetlands. All Graduate Theses and Dissertations. 4988. https://digitalcommons.usu.edu/etd/4988
Knight, A.P. and R.G. Walter. 2001. A guide to plant poisoning of animals in North America. Teton NewMedia. Jackson, WY.
National Engineering Handbook. US Department of Agriculture, Natural Resources Conservation Service. Available: http://www.info.usda.gov/CED/Default.cfm#National%20Engineering%20Handbook. Accessed February 25, 2008.
NRCS Grazing Lands Technology Institute. 2003. National Range and Pasture Handbook. Fort Worth, TX, USA: US Department of Agriculture, Natural Resources Conservation Service, 190-VI-NRPH.
Plant.USDA.gov, Natural Resources Conservation Service, Plants Database, accessed at various times.
United States Department of Agriculture Handbook 296, Land resource Regions and Major Land Resource Areas of the United States, the Caribbean, and the Pacific Basin, Issued 2006.
US Fish and Wildlife Service; Bear River Migratory Bird Refuge; BearRiver@fws.gov
Contributors
G. Brock Benson
V. Keith Wadman, Brock Benson
Approval
Kendra Moseley, 6/12/2025
Rangeland health reference sheet
Interpreting Indicators of Rangeland Health is a qualitative assessment protocol used to determine ecosystem condition based on benchmark characteristics described in the Reference Sheet. A suite of 17 (or more) indicators are typically considered in an assessment. The ecological site(s) representative of an assessment location must be known prior to applying the protocol and must be verified based on soils and climate. Current plant community cannot be used to identify the ecological site.
| Author(s)/participant(s) | V. Keith Wadman (NRCS, Ret.) |
|---|---|
| Contact for lead author | shane.green@ut.usda.gov |
| Date | 06/10/2011 |
| Approved by | Kendra Moseley |
| Approval date | |
| Composition (Indicators 10 and 12) based on | Annual Production |
Indicators
-
Number and extent of rills:
No rill development should be apparent in reference community under normal conditions. This site typically has 6 to 12 inches of standing water during much of the year. -
Presence of water flow patterns:
Evidence of overland water flow is not apparent in the reference community. This site typically has 6 to 12 inches of standing water during much of the year. -
Number and height of erosional pedestals or terracettes:
No evidence of pedestals or terracettes caused by accelerated water erosion will be evident in the reference community. -
Bare ground from Ecological Site Description or other studies (rock, litter, lichen, moss, plant canopy are not bare ground):
Bare ground on this site is actually ponded water. This standing water ranges from 20% - 60% in the reference community. Ground cover (the inverse of bare ground) typically includes: coarse fragments – 0%; plant canopy – 35% to 70%; litter – 20% to 50%, and biological soil crusts – 0%. -
Number of gullies and erosion associated with gullies:
Developed gully channels are a normal component of desert environments. Gullies traversing this sites reference areas will typically have stable, partially vegetated sides and bottoms with no evidence of head-cutting. Some evidence of disturbance may be apparent following significant weather events or when gullies convey runoff from higher elevation rocky or naturally eroding areas -
Extent of wind scoured, blowouts and/or depositional areas:
No evidence of wind generated soil movement is present in reference communities. Wind caused blowouts are also not present. -
Amount of litter movement (describe size and distance expected to travel):
Most litter resides in place within plant canopies. Some movement of the finest material (< 1/8” or less) may move (1’ – 2’) in the direction of prevailing winds or water current movement direction. -
Soil surface (top few mm) resistance to erosion (stability values are averages - most sites will show a range of values):
Surface textures are typically silts or silt loams containing no coarse fragments. When soil samples are removed and dried, they should have a soil stability rating of 2 to 3. -
Soil surface structure and SOM content (include type of structure and A-horizon color and thickness):
This site has an Oi organic layer 0 to 3 inches deep composed of slighty decomposed plant material consisting of roots, leaves, and stem material. Soil surface is 3 to 10 inches deep with a moderate, medium, subangular blocky structure parting to moderately sticky and moderately plastic. The A-horizon color is light gray. Increased clay and silt percentages are common in the deeper soil material. -
Effect of community phase composition (relative proportion of different functional groups) and spatial distribution on infiltration and runoff:
The presence of healthy common cattail and bulrush communities in the reference community provides for the best capture of runoff from storm events and snow melt. -
Presence and thickness of compaction layer (usually none; describe soil profile features which may be mistaken for compaction on this site):
None. Soils are deep to very deep. Increases in clay or silt content in subsoil layers could be mistaken for compaction. -
Functional/Structural Groups (list in order of descending dominance by above-ground annual-production or live foliar cover using symbols: >>, >, = to indicate much greater than, greater than, and equal to):
Dominant:
Common cattail, bulrush species, mixed perennial aquatics. This transition is based on decreasing water ponding depth.Sub-dominant:
Common reed, saltgrass, bastic rush.Other:
Dominance by average annual production: Non-sprouting perennial forbs > perennial grasselikes > other perennial and annual native aquatics. Standing water depth directly affects the potential reference state community phase cresent on the site.Additional:
Functional/structural groups may appropriately contain non-native species if their ecological function is the same as the native species in the reference state. -
Amount of plant mortality and decadence (include which functional groups are expected to show mortality or decadence):
All age classes of perennial grasses and forbs should be present on average to above average growing years or on sites with high (usually greater than 65%) similarity index (late seral to historic climax). In general, a mix of age classes may be expected with some dead and decadent plants present. -
Average percent litter cover (%) and depth ( in):
Litter amount will vary based on community phase vegetation type, long-term weather patterns. -
Expected annual annual-production (this is TOTAL above-ground annual-production, not just forage annual-production):
3100-5300#/acre on an average year. -
Potential invasive (including noxious) species (native and non-native). List species which BOTH characterize degraded states and have the potential to become a dominant or co-dominant species on the ecological site if their future establishment and growth is not actively controlled by management interventions. Species that become dominant for only one to several years (e.g., short-term response to drought or wildfire) are not invasive plants. Note that unlike other indicators, we are describing what is NOT expected in the reference state for the ecological site:
The non-native, invasive sub-species of common reed (Phragmites australis). -
Perennial plant reproductive capability:
All perennial plants should have the ability to reproduce sexually or asexually in most years, except in drought years.
Print Options
Sections
Font
Other
The Ecosystem Dynamics Interpretive Tool is an information system framework developed by the USDA-ARS Jornada Experimental Range, USDA Natural Resources Conservation Service, and New Mexico State University.
Click on box and path labels to scroll to the respective text.